Introduction
In Lesson 1 of this chapter you saw several different quadratic models. Two of these models were $y = - {x^2} + 400x$ and $y = - 20{x^2} + 360x$. These models are different in the sense that the equations look different, but are their graphs different, too?
Set the window dimensions of your calculator to ${\rm{Xmin}} = - 50$, ${\rm{Xmax}} = 400$, ${\rm{Xscl}} = 50$, ${\rm{Ymin}} = - 5000$, ${\rm{Ymax}} = 40000$, and ${\rm{Yscl}} = 5000$. Now, graph $y = - 20{x^2} + 360x$ and $y = - {x^2} + 400x$. What do you see? Are the graphs identical to each other?
While the graphs were not identical, they were both parabolas. When we studied transformations we learned that we can take a triangle, for example, and transform it into a triangle of the same shape but a different size and in a different place. We also learned that we can stretch a triangle in just one direction and change its shape while still preserving the fact that it’s a triangle. A natural question at this point might be the following: Can the graphs of the two parabolas seen in Problem 1 be transformed into each other? Put another way: Is it possible to take the graph of $y = - {x^2} + 400x$ and shift it, stretch it, or flip it over some line in order to get it to be identical to the graph of $y = - 20{x^2} + 360x$? Rather than tackle this actual question now, we will examine a similar problem by looking at simpler equations.
Development
Use the standard window to graph the quadratic function $y = {x^2}$ on your calculator. The standard window has ${\rm{Xmin}} = - 10$, ${\rm{Xmax}} = 10$, ${\rm{Xscl}} = 1$, ${\rm{Ymin}} = - 10$, ${\rm{Ymax}} = 10$, and ${\rm{Yscl}} = 1$.
For what values of $x$ does the graph, as you move from left to right, go down? go up?
Why does the graph not appear in the 3rd or 4th quadrants?
The previous questions were designed to help you get a feel for the shape of the graph of $y = {x^2}$. Often it helps to have this kind of feel before you start to investigate how you can transform this shape. So, now that you have a feel for this graph, let’s look at some transformations of it.
In the same window you graphed $y = {x^2}$, graph $y = {x^2} + 3$.
Do the graphs appear congruent — the exact same size and shape?
Complete the table below.
|
$x$ |
-2 |
-1 |
0 |
1 |
2 |
3 |
4 |
|
$y = {x^2}$ |
4 |
||||||
|
$y = {x^2} + 3$ |
7 |
The completed table in Problem 3 Part b should lead you to think that the graphs of $y = {x^2}$ and $y = {x^2} + 3$ really are congruent to each other, differing only in their location. It’s important to note that we haven’t proven this to be true; we’ve only gathered evidence that supports this notion.
In what direction should you shift the graph of $y = {x^2}$ so that it would exactly coincide with the graph of $y = {x^2} + 3$? By how much should the graph be shifted? You should be able to give a precise answer to this.
One way of answering Problem 4 is by saying that the graph of $y = {x^2} + 3$ is a vertical translation up 3 units of the graph of $y = {x^2}$. There is synonymous language — vertical shift up 3 units, for example. Don’t worry about using the exact same terms that everyone else is using when trying to describe the transformation that has occurred, but do worry about whether your language is accurate.
In the standard window graph $y = {x^2}$, $y = {x^2} + 6$, $y = {x^2} - 2$, and $y = {x^2} - 10$. Thinking about what you wrote in Problem 4, and what you read in the above paragraph, what conjecture can you make regarding the graphs of $y = {x^2}$ and $y = {x^2} + k$? Be specific.
Graphical transformations allow us to produce new quadratic functions that as a consequence have transformed coordinate pairs.
The point $\left( {5,25} \right)$ is on the graph of $y = {x^2}$. How could you shift the graph of $y = {x^2}$ to produce a new quadratic function where $\left( {5,32} \right)$ is on its graph? What would be the equation of this new graph?
The point $\left( {4,16} \right)$ is on the graph of $y = {x^2}$. How could you shift the graph of $y = {x^2}$ to produce a new quadratic function where $\left( {4, - 77} \right)$ is on its graph? What would be the equation of this new graph?
Graph $y = {x^2}$, $y = 3{x^2}$, and $y=\frac{1}{2}x^2$ in the standard window. Make sure you can see all of the important features of each of the graphs. Now, describe how you would transform the graph of $y = {x^2}$ into each of the other graphs. Be as precise as possible.
There are many possible answers to Problem 7. A very common one is to say that you would horizontally compress (make narrower) toward the $y$-axis the graph of $y = {x^2}$ in order to get the graph of $y = 3{x^2}$ and horizontally stretch (make wider) away from the $y$-axis the graph of $y = {x^2}$ in order to get the graph of $y=\frac{1}{2}x^2$. Sometimes a person who describes the changes in this way will go on to write that the graph of $y = {x^2}$ would be compressed by a factor of 3 (made 1/3 as small) in the first case and stretched by a factor of 2 in the second case. It’s not easy checking the accuracy of these statements, but as it turns out, these statements about the factors are not quite right. Let’s look at another way of transforming the graph of $y = {x^2}$ into the graph of $y = 3{x^2}$ or the graph of $y=\frac{1}{2}x^2$.
In Problems 3-6 we saw that if you add a quantity (positive or negative) to ${x^2}$ the graph of the new equation will shift vertically. Since 3 is multiplying ${x^2}$ in the equation $y = 3{x^2}$, let’s see whether the graph of $y = {x^2}$ changes vertically. In order to do this it’s best that we plug the same $x$-values into each equation and compare corresponding $y$-values.
Complete the table below.
|
$x$ |
-2 |
-1 |
0 |
1 |
2 |
3 |
4 |
|
$y = {x^2}$ |
4 |
||||||
|
$y = 3{x^2}$ |
12 |
Use the table in Problem 8 to answer the following questions.
What is the height of the graph of $y = {x^2}$ at $x = - 2$— i.e., what is the vertical distance between the $x$-axis and the point on the graph where $x = - 2$? What is the height of $y = 3{x^2}$ at this same value of $x$?
How do the two answers you arrived at in Part a relate to each other? Would this be the same relationship if instead of looking at $x = - 2$ you looked at $x = - 1$? $x = 4$? If your answer is “no”, then come up with a relationship that would be true for the $y$-values at each of these $x$-values.
Using what you have learned in Part b describe precisely — using the language of transformations that you learned back in Chapter 1 — how you can transform the graph of $y = {x^2}$ into the graph of $y = 3{x^2}$.
Now, think about what you determined in Problem 9 and describe precisely how you can transform the graph of $y = {x^2}$ in order to get the graph of $\frac{1}{2}x^2$. If you need to, make a table similar to the one in Problem 8 as a way of checking your description.
In Problems 8-10 you only looked at how the graph of $y = {x^2}$ can be transformed into the graph of $y = a{x^2}$ when $a > 0$. What happens when $a < 0$?
Describe precisely how you can transform the graph of $y = {x^2}$ into the graph of $y = - {x^2}$.
Now describe precisely how you can transform the graph of $y = {x^2}$ into the graph of $y = - 2{x^2}$. Be prepared to justify your description with a table.
There are two transformations that occur in Problem 12: a reflection of the graph over the $x$-axis and a vertical stretch away from the x-axis by a factor of 2. Does the order of the transformations matter — in other words, if you reflect over the $x$-axis first and then vertically stretch will that result in the same graph if you had vertically stretched first and then reflected over the $x$-axis?
What can you say in general about the relationship between the graphs of $y = {x^2}$ and $y = ax^2$ when $a \ne 0$?
The points $\left( {10,100} \right)$ and $\left( { - 4,16} \right)$ are on the graph of $y = {x^2}$.
How can you vertically stretch or shrink the graph $y = {x^2}$ to produce a new quadratic function where $\left( {10,400} \right)$ and $\left( { - 4,64} \right)$ are on its graph? What would be the equation of this new graph?
How can you vertically stretch or shrink the graph of $y = {x^2}$ to produce a new quadratic function where $\left( {10,20} \right)$ and $\left( { - 4,3.2} \right)$ are on its graph? What would be the equation of this new graph?
The point $\left( {6, - 18} \right)$ is on the graph of $y = a{x^2}$. Determine the value of $a$. Can you do this by using transformations?
You may have noticed that it’s quite tedious to keep saying that the graph has been vertically stretched “away from the $x$-axis” or compressed “toward the $x$-axis”. In Chapter 1 you learned that there is a simple formula that describes dilations or compressions if they are done around $\left( {0,0} \right)$. Throughout this lesson, we will be seeking simple, formulaic ways of describing vertical stretching or shrinking, so we will always take the $x$-axis as the line from which we stretch or toward which we compress. Hence, we will say, “the graph of $y = 3{x^2}$ is a vertical stretch by a factor of 3 of the graph of $y = {x^2}$”; there’s no need to mention the $x$-axis.
Practice
Describe how to transform the graph of $y = {x^2}$ into the graph of the given equation.
$y = {x^2} + 0.5$
$y = - 10{x^2}$
$y = {x^2} - 10$
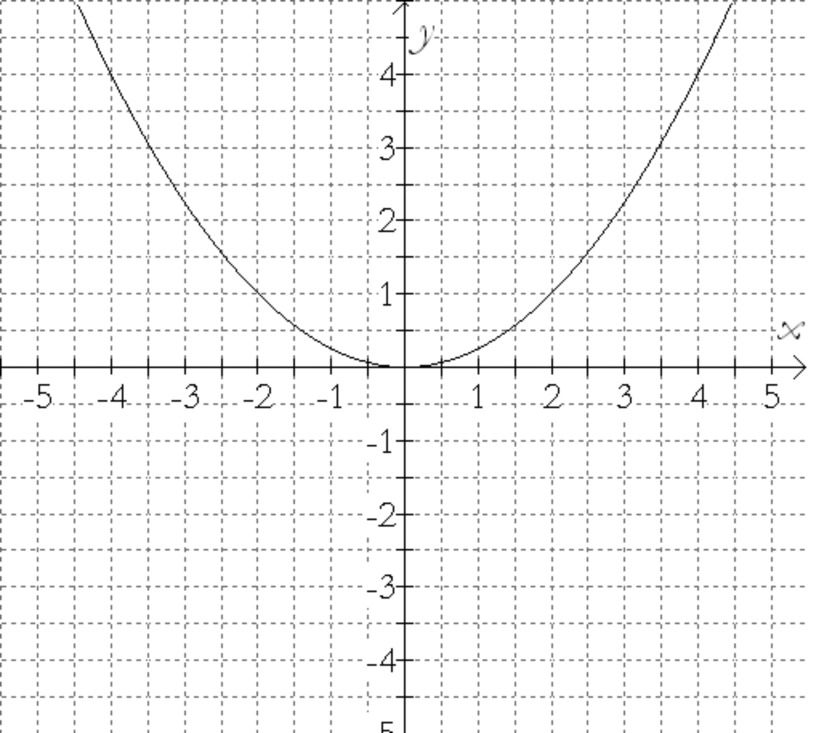
Without using your calculator, graph each of the following equations on the same axis system.
$y = {x^2}$
$y = {x^2} - 2$
Determine the value of $a$ such that $\left( {2,10} \right)$ is on the graph of $y = a{x^2}$.
Determine the value of $k$ such that $\left( {2,10} \right)$ is on the graph of $y = {x^2} + k$.
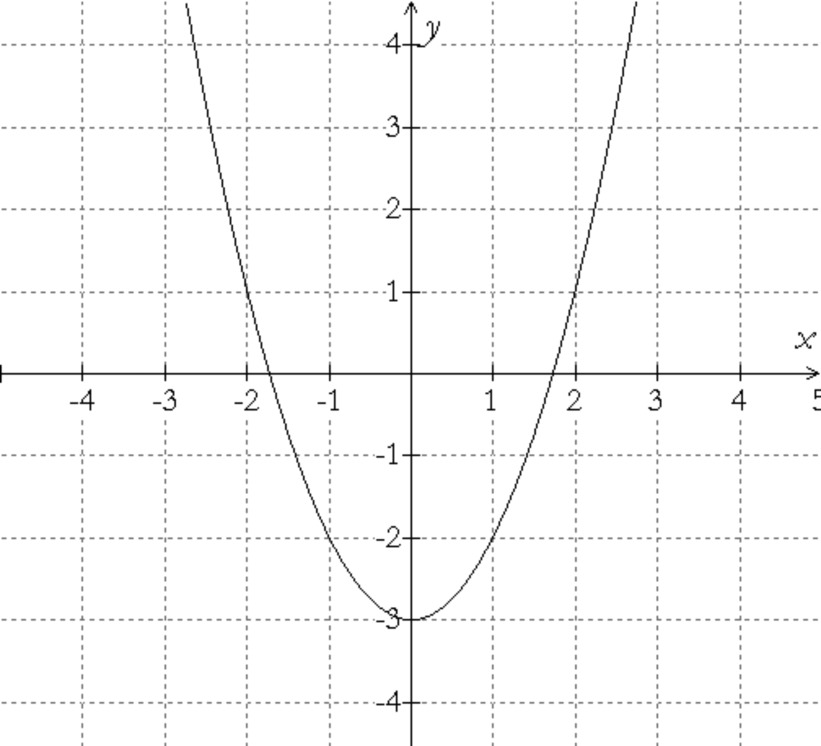
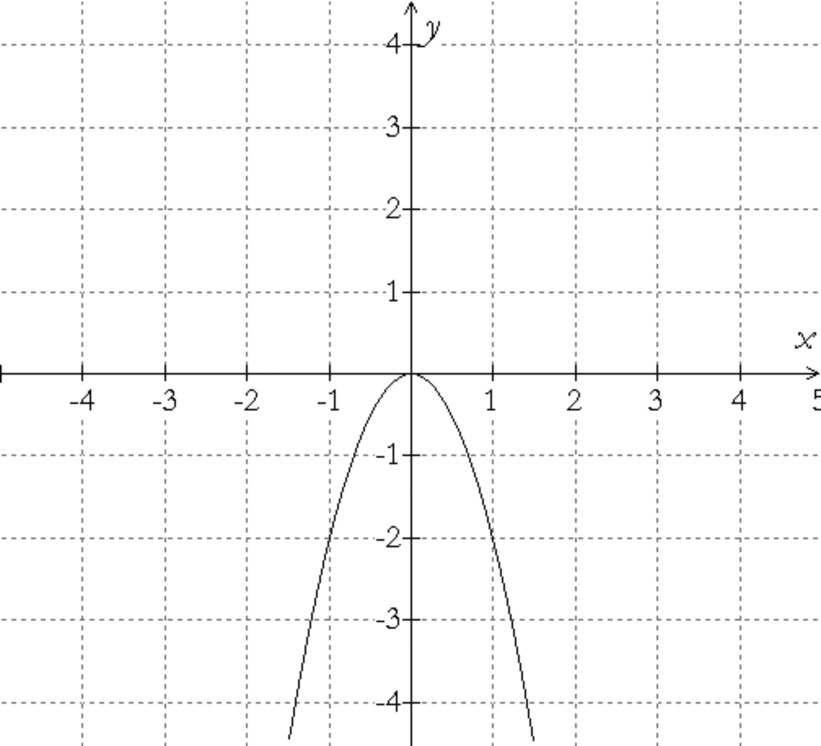
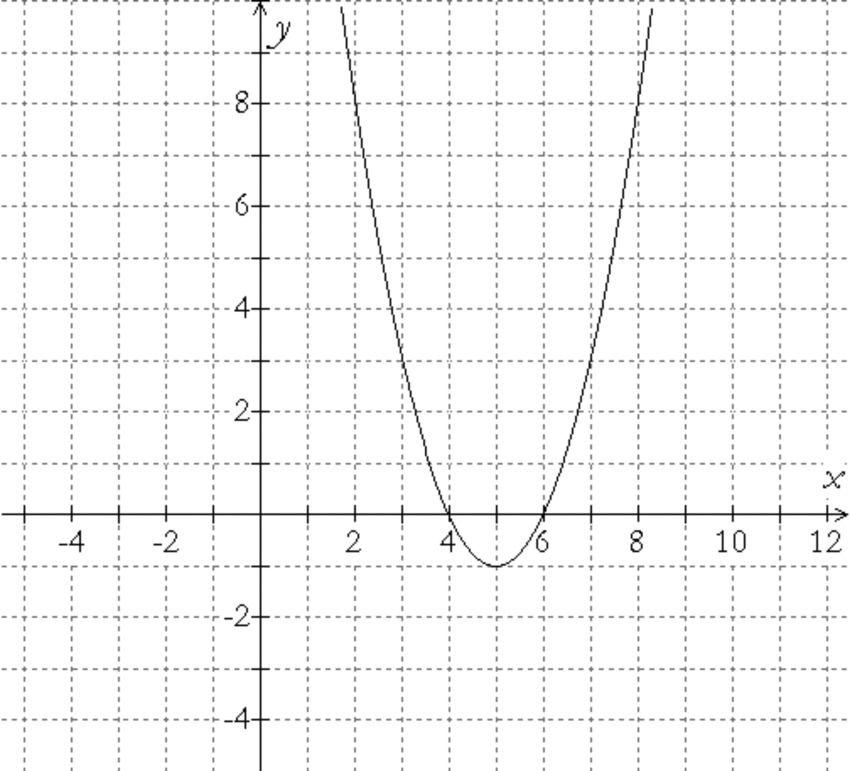
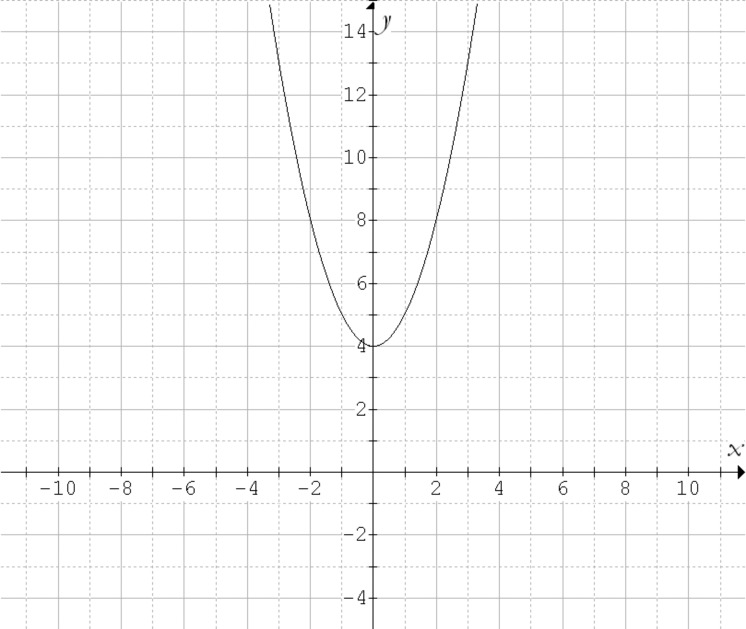
Write an equation for the given graph.
Going Further
Graph $y = {x^2}$ and $y = (x-4)^2$ in the same window on your calculator. Make sure you can see complete graphs of each of the functions. Describe as precisely as possible how you can transform the graph of $y = {x^2}$ into the graph of $y = (x-4)^2$.
You may have noticed in Problem 22 that the two graphs appear to be the same size and shape but are in different places along the $x$-axis. In this sense the graphs look like they’re horizontal translations of each other. One way of determining the precise magnitude and direction (left or right) of this translation is to focus on where the vertex is on each graph. Since these points correspond to each other — in the same way that the corner points of two triangles would correspond to each other — you can probably figure out what the horizontal translation is by looking at these points. The diagram below shows the two graphs, along with their indicated vertices.
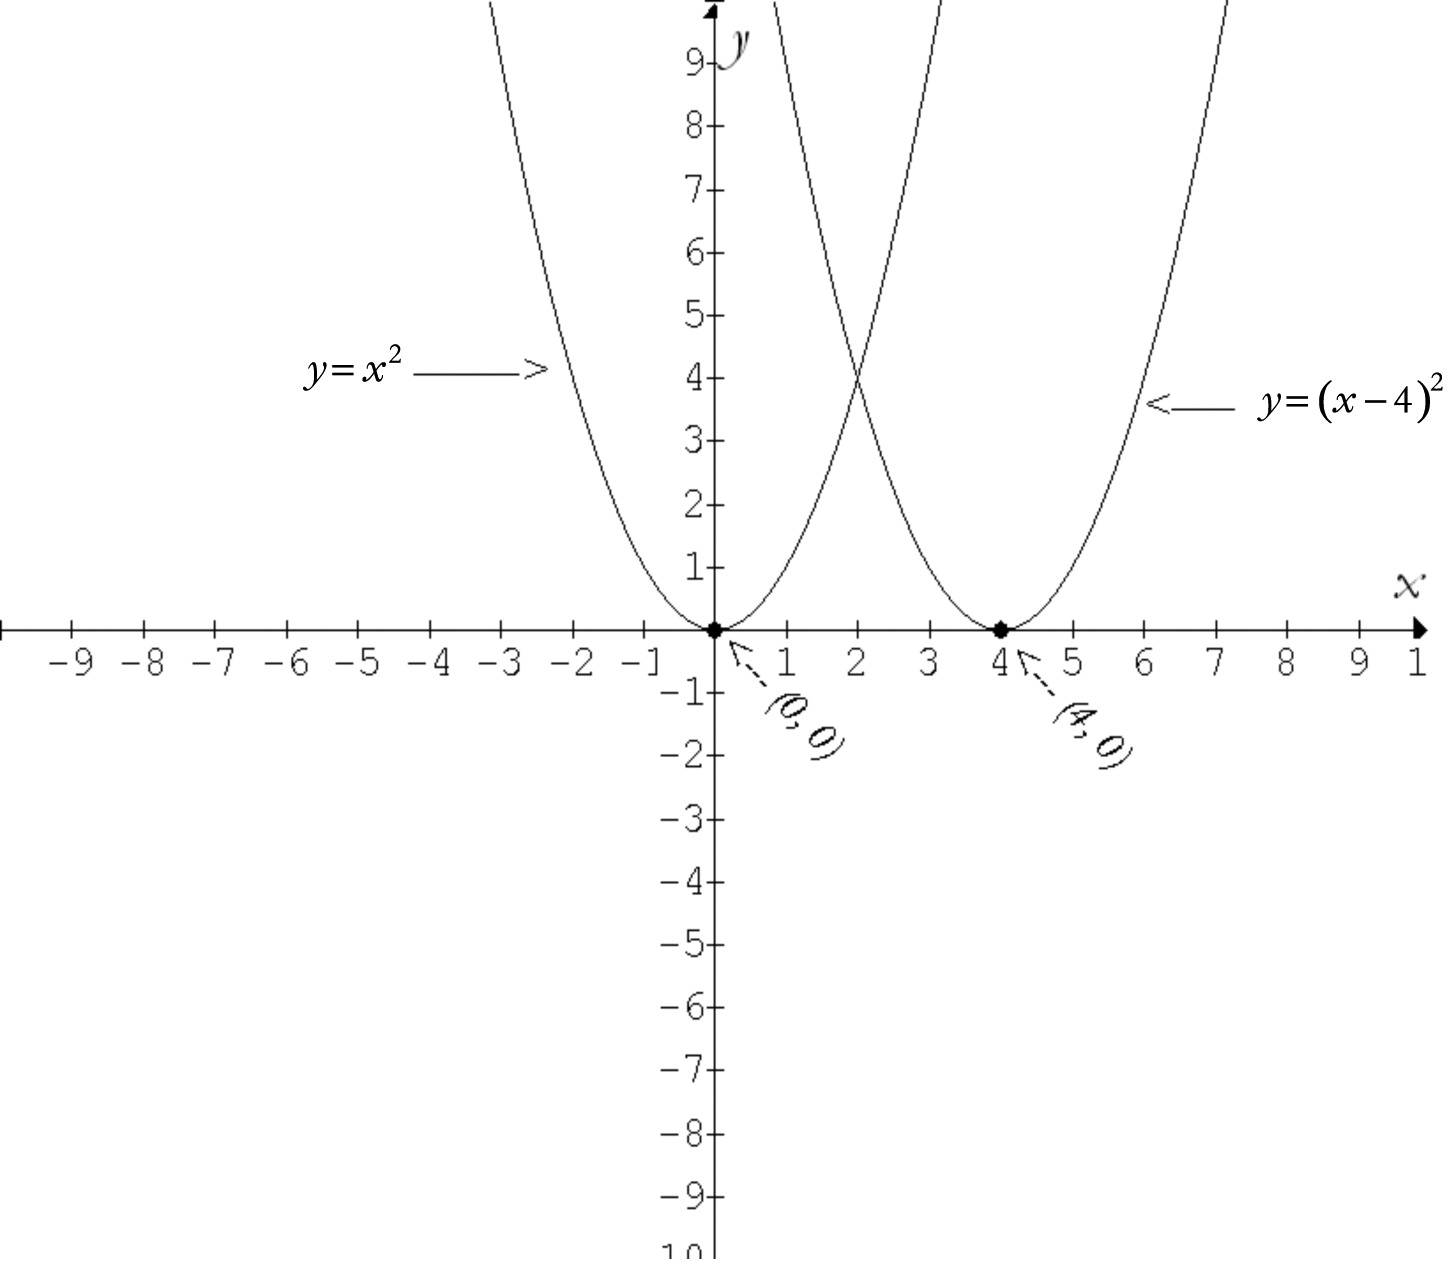
From this diagram we can see that the graph of $y = (x-4)^2$ appears to be 4 units to the right of the graph of $y = {x^2}$. So, if we horizontally translate the graph of $y = {x^2}$ to the right 4 units we can get the graph of $y = {\left( {x - 4} \right)^2}$. Notice that though the equation indicates that 4 is being subtracted from $x$, the graph moves right 4 units, not left 4 units. Let’s look at a few more graphs before we investigate this apparently strange behavior.
Graph $y = {x^2}$ and $y = (x+3)^2$ in the same window. Describe how you would transform the graph of $y = {x^2}$ in order to get the graph of $y = (x+3)^2$.
Without using your calculator describe how you would transform the graph of $y = {x^2}$ in order to get the graph of $y = {\left( {x + 1} \right)^2}$. How would you transform it into the graph of $y = {\left( {x - 7} \right)^2}$? Check your work by using your calculator.
Problems 23 and 24 probably confirmed your sense of what was going on in Problem 22, not only in that the transformation is horizontal but also that it is “opposite” of what you might expect just from looking at the equation. One way of trying to understand what’s going on here is to isolate the variable that appears to be affected by the transformation — the “$x$” variable — by controlling the values of the other variable — the “$y$” variable. We can do this by creating a table in which the y-values are the same for each equation.
Complete the table below. For some $y$-values there are two values of $x$ that could go into the box. Write only one of these $x$-values. Also, you’ll need to think about which $x$-value you want to write if you want to uncover a pattern.
|
$y$-values |
0 |
1 |
4 |
9 |
16 |
25 |
36 |
|
$x$-values for $y = {x^2}$ |
0 |
||||||
|
$x$-values for $y = (x-3)^2$ |
3 |
What is the relationship between the $x$-values for $y = {x^2}$ and the corresponding $x$-values for $y = (x-3)^2$? Is this relationship consistent with your answers to Problems 22-24?
What can you say in general about the relationship between the graphs of $y = {x^2}$ and $y = (x-h)^2$?
Three points on the graph of $y = {x^2}$ are $P = \left( {3,9} \right)$, $Q = \left( {7,49} \right)$, and $R = \left( { - 1.5,2.25} \right)$. Just as the graph of $y = {x^2}$ gets transformed into the other two graphs of Problem 24, points $P$, $Q$, and $R$ are transformed as well and end up with “new” coordinates.
Give the “new” coordinates for $P$, $Q$, and $R$ on the graph of $y = (x+5)^2$.
Give the “new” coordinates for $P$, $Q$, and $R$ on the graph of $y = {\left( {x - 1.5} \right)^2}$.
Give the “new” coordinates for $P$, $Q$, and $R$ on the graph of $y = (x+b)^2$.
There are two transformations done on the graph of $y = {x^2}$ in order to get the graph of $y = {\left( {x - 3} \right)^2} - 4$. What are they? Does the order in which they are applied matter?
Practice
Describe how to transform the graph of $y = {x^2}$ into the graph of the given equation.
$y = {\left( {x + 3} \right)^2} - 2$
$y = - {\left( {x - 5} \right)^2}$
$y = 110(x-35)^2$
Without using your calculator, graph each of the following equations. Identify the exact coordinates of two points on the graph.
$y = {\left( {x - 1} \right)^2} + 2$
$y = {\textstyle{1 \over 2}}{\left( {x + 6} \right)^2}$
Determine the values of $h$ and $k$ such that the given point will be the vertex of the graph of $y = {\left( {x - h} \right)^2} + k$.
$\left( {3, - 6} \right)$
$\left( { - 2,5} \right)$
$\left( { - 7,0} \right)$
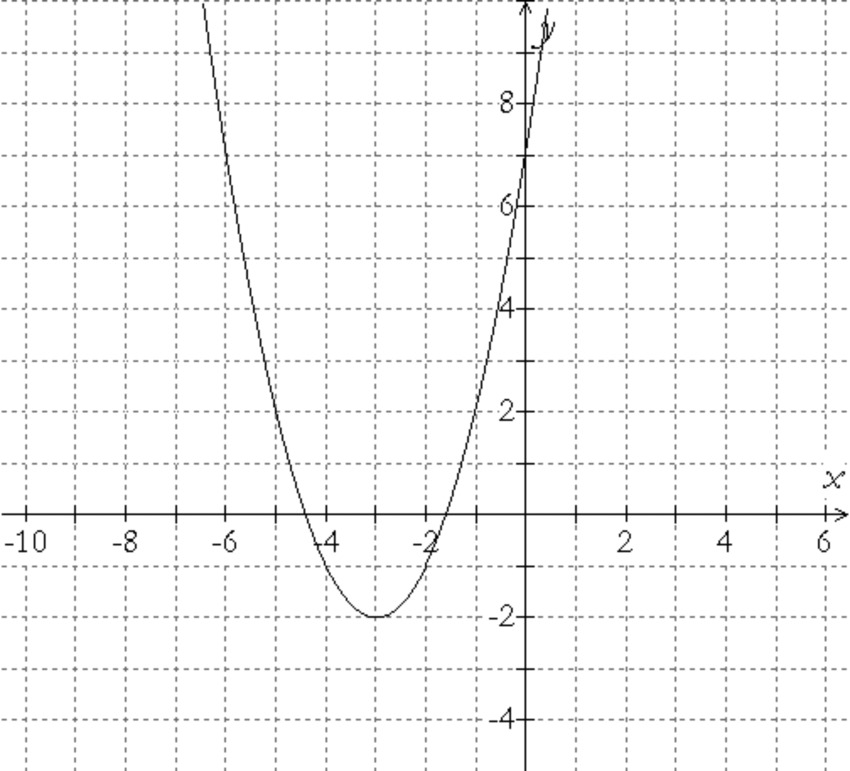
Write an equation for the given graph.
Problems
Describe three different transformations of the graph of $y = {x^2}$ that would transform the point $\left( {2,4} \right)$ to $\left( {2,20} \right)$. How many transformations do you think there could be? Justify your answer.
The point $\left( {5,4} \right)$ is on the graph of $y = {\left( {x - b} \right)^2}$: it is a transformation of the point $\left( {2,4} \right)$ on $y = {x^2}$. Find a value of $b$ that makes sense. Can you find a second value for $b$ that works as well? Why would there be two values?
Write two tables that clearly illustrate what type of transformation is used on the graph of $y = - {x^2}$ to get the graph of $y = - {\left( {x + 2} \right)^2}$.
Describe a way that you can prove to someone that the graph of $y = 5{x^2}$ is not a horizontal compression by a factor of 5 of the graph of $y = {x^2}$. Your explanation cannot be akin to saying, “Well…because it’s a vertical stretch by a factor of 5.”
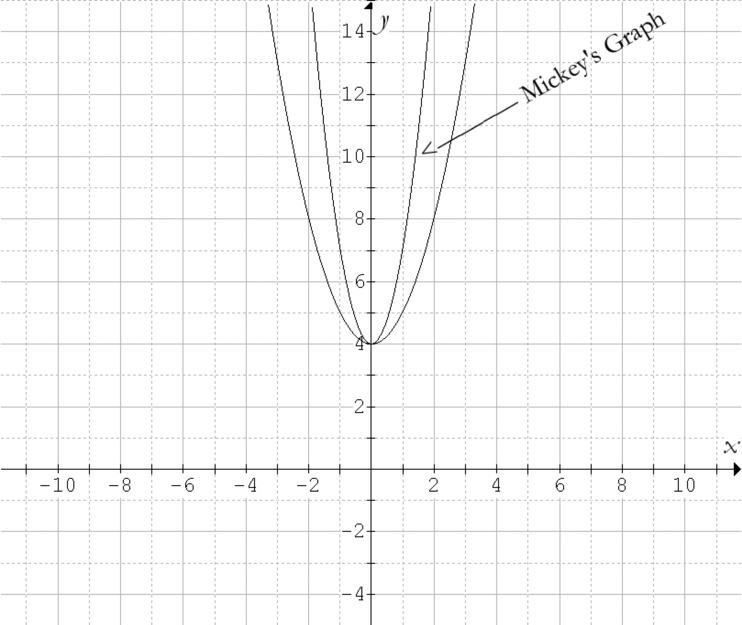
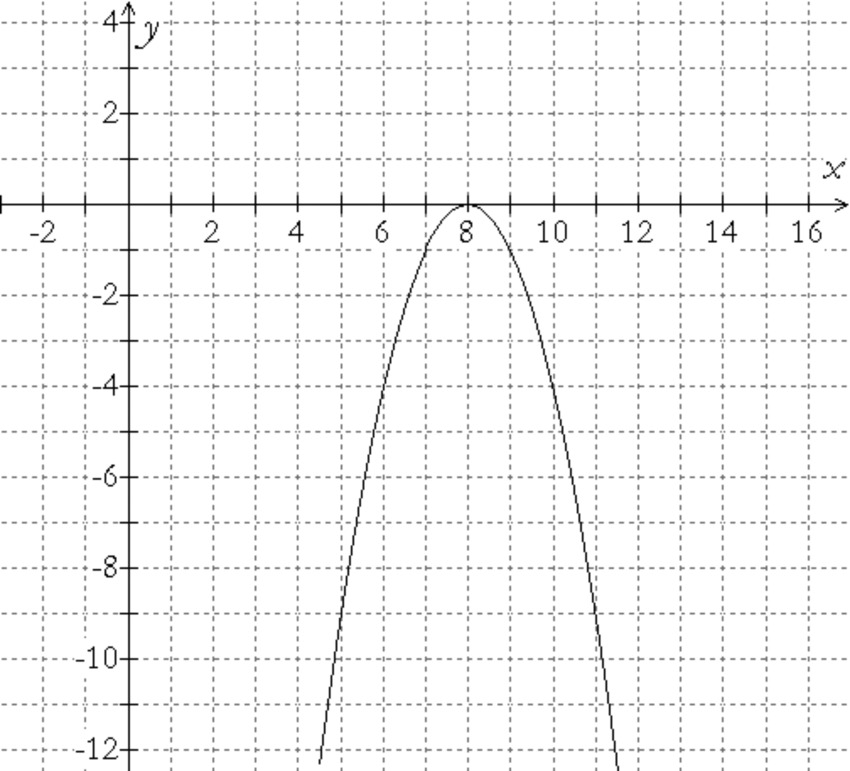
Explain why Mickey’s graph is incorrect.
On Figure 1, draw the correct graph.
Write an equation for Mickey’s graph. Now, write an equation for the graph you drew in Part b.
The graph of $y = 3{\left( {x + 2} \right)^2}$ can be transformed into the graph of $y = {\textstyle{1 \over 2}}{\left( {x - 3} \right)^2}$.
Describe one such transformation.
Describe how to transform the graph of $y = {\textstyle{1 \over 2}}{\left( {x - 3} \right)^2}$ into the graph of $y = 3{\left( {x + 2} \right)^2}$.
What relation, if any, does your answer in Part a have to your answer in Part b?
The graph of a quadratic equation has $x$-intercepts of -4 and 3 and a $y$-intercept of -7. Suppose you transform this graph by translating it 3 right and then reflecting it over the $x$-axis. Identify the exact coordinates of 3 points on this new graph. Are any of these points a $y$-intercept? Why?
Let $f(x) = {(x - 1)^2} + 2$.
Make a graph of the function $f$, with $x$ on the horizontal axis and values of $f(x)$ on the vertical axis.
On separate axes, graph the
equation $y = f(x) + 3$– that is, to calculate the
On separate axes, graph the
equation $y = f(x + 3)$– that is, to calculate the
Use what you have learned in parts b and c to quickly graph the equation $y = f(x + 1) - 5$.
Don’t use a calculator for this problem.
Divide $3 \div \frac{2}{3}$
Simplify $[2( - 5 + 3) - ( - 4 - 1)](342 - 142)$
Subtract $1\frac{4}{5} - \frac{7}{10}$
Solve for $x$ if $|x - 7| = 3$. Then solve for $x$ if $|x| - 7 = 3$.
Solve for $x$ and $y$: $\begin{array}{l} 2x + 5y = - 10\\ 6x - 10y = 45 \end{array}$
At what $x$-value(s) does the graph of $y = a{x^2} - b$ cross the $x$-axis? Is this true for all possible values of $a$ and $b$?
Graph $y = {x^2}$ and $y = {x^2} + 6x$ in the same window. It’s difficult to see whether the graphs are the same size and shape since they are not in the same place.
How would you transform the graph of $y = {x^2}$ so that it is in the same place as the graph of $y = {x^2} + 6x$?
Once you have transformed the graph of $y = {x^2}$ you should be able to write an equation in the form $y = {\left( {x - h} \right)^2} + k$ for this transformed graph. What will be the values of $h$ and $k$?
Are the graphs of $y = {x^2}$ and $y = {x^2} + 6x$ the same size and shape? How do you know that your answer must be correct?
Given what you have learned in Problem 44, see what you can do with the problems below.
Are the graphs of $y = {x^2}$ and $y = {x^2} - 10x$ the same size and shape? How do you know that your answer must be correct?
Are the graphs of $y = {x^2}$ and $y = {x^2} + 8x - 1$ the same size and shape? Justify your response.
Show that $y = {x^2} + 4x - 3$ and $x^2 - 10x + 5$ are the same size and shape.
Let $y = \left( {x + 3} \right)\left( {x - 5} \right)$.
Without using your calculator, draw
a graph of the function. Label the exact coordinates of the
vertex, the two
An equation in the form $y = {\left( {x - h} \right)^2} + k$ can be written for the graph in Part a. Write this equation.
Use algebra to prove that the original factored-form equation and the equation that you wrote in Part b are equivalent.
Suppose you were trying to explain to someone why the graph of $y=(x-2)^2$ is a horizontal translation to the right by 2 units of the graph of $y = {x^2}$. Construct two tables, each having 5 ordered pairs (5 points), that you could use to show why the translation occurs the way it does. The tables should make this plainly obvious. Write a short explanation indicating how the tables show the correct translation.
Let $y = \left( {x + 4} \right)\left( {x + 6} \right)$.
What are the $x$-intercepts of the graph of the function?
Suppose the graph was translated 3 units to the left. Write, in factored form, an equation for this new graph.
Demonstrate that your answer in part b is correct by showing algebraically that the graph of your answer is a translation of the graph of the original equation.
In thinking about what she learned
about horizontal translations Jessica decided to solve part b
by replacing
each “$x$” in the original equation with
Suppose the original graph was translated 5 units to the right. Use Jessica’s thinking to write an equation for this new graph.
When you learned transformations in the context of coordinate geometry you learned that translating a figure does not change its size or shape: in a sense you may have thought that translations don’t change any aspect of the figure. Is this true for graphs of quadratic functions? Are there aspects of the graph ($x$-intercepts, $y$-intercept, vertex, etc.) that don’t change? Are there aspects that do? Are these changes predictable? Are there aspects that change but there is essentially no way of predicting what the outcome will be?
Exploring in Depth
The graph of the equation $y = 2{x^2} + 4$ involves two transformations of the graph of $y = {x^2}$: a vertical translation up 4 units and a vertical stretch by a factor of 2.
If you were going to graph $y = 2{x^2} + 4$ by actually transforming the graph $y = {x^2}$ should you apply the translation first and then the vertical stretch or should the transformations be done in the other order? Explain how you know that your answer is correct without referring to the graphing or table features of your calculator.
There is an algebraically equivalent form of the equation $y = 2{x^2} + 4$ that will allow you to apply a vertical translation first and then a vertical stretch, though the magnitudes of the translation and/or the stretch will not necessarily be 4 and 2, respectively. Find this equivalent form.
For each equation, determine the transformations needed in order to transform $y = {x^2}$ into the graph of the given equation.
- $y = - 3{x^2} - 2$
- $y = {\textstyle{1 \over 2}}\left( {{x^2} + 4} \right)$
- $y = 3{\left( {x + 4} \right)^2} - 1$
- $2y + 1 = {\left( {x - 3} \right)^2}$
Describe how to transform the graph of $y=-x^2+400x$ into the graph of $y = - 20{x^2} + 360x$.
Let $y = \left( {x + 2} \right) + 3$. Do not simplify this equation. And, “yes”, the equation has been written correctly.
The graph of the given equation is a transformation of the graph of what much simpler equation?
What are the transformations involved of the graph of the simpler equation?
On a coordinate axis system, draw a graph of the simple equation you identified in Part a. Now, apply the transformations that you identified in Part b to this graph. Is the final graph the correct graph for $y = (x+2) + 3$? Check your work.
Graph $y = - 3x$ by transforming the graph of a simpler equation.
Compare the graphs of $y = {x^2}$ and $y = {\left( {3x} \right)^2}$. What type of horizontal transformation can you do on the graph of $y = {x^2}$ in order to get the graph of $y = {\left( {3x} \right)^2}$? Be precise in your description and justify your description with two tables that clearly show why the transformation is what it is.
Determine the value(s) of $p$ such that $(p,5p)$ is on the graph of $y = 3{x^2} - 2$.
Recall that a circle consists of the set of points in a plane that are equidistant (the same distance) from a fixed point.
Let $\left( {x,y} \right)$ be a point that is 5 units from the fixed point $\left( {0,0} \right)$. There are many possible points that $\left( {x,y} \right)$ could represent. Sketch all of them.
Write an equation that describes the fact that $\left( {x,y} \right)$ is 5 units from $\left( {0,0} \right)$. Write your final answer to this question so that it has no square roots in it.
Now, sketch all of the points $\left( {x,y} \right)$ that are 5 units from the fixed point $\left( {2,0} \right)$. Use the Pythagorean Theorem to write an equation that describes the fact that $\left( {x,y} \right)$ is 5 units from the fixed point $\left( {2,0} \right)$.
Explain how you can use transformations to write the equation you derived in Part c.
Use transformations to write the equation that describes all the points $\left( {x,y} \right)$ that are 5 units from the fixed point $\left( {4,1} \right)$. Show that your answer is correct by deriving your answer through the Pythagorean Theorem.