Introduction: Three Challenges
Felix will fly into Birmingham tomorrow to visit some family members. Today, he has his Alabama map spread out over a table in the local coffee shop to determine the route he will drive with his pay-per-mile rental car. He has a cousin in Birmingham, grandparents in Huntsville, an aunt in Cottondale, and a brother in Tuscaloosa. When Felix realized that he’ll soon be served some of his grandma’s chicken liver-sardine-cranberry casserole, he gagged on his cappuccino and accidentally spilled the whole cup on his map. The only usable part of the map remaining is the mileage chart between cities. Here is the mileage between the relevant cities:
|
Birmingham |
Huntsville |
Cottondale |
Tuscaloosa |
|
|
Birmingham |
X |
102 |
50 |
56 |
|
Huntsville |
102 |
X |
148 |
143 |
|
Cottondale |
50 |
148 |
X |
9 |
|
Tuscaloosa |
56 |
143 |
9 |
X |
In what order should Felix visit his relatives to minimize the number of miles he drives with the rental car? Remember that he has to return to Birmingham to return the rental car.
Below is a map of part of the Middle East. You have different colors you can use to color in the different countries. If two countries are touching, then you should make them different colors so someone can easily tell they’re different countries.
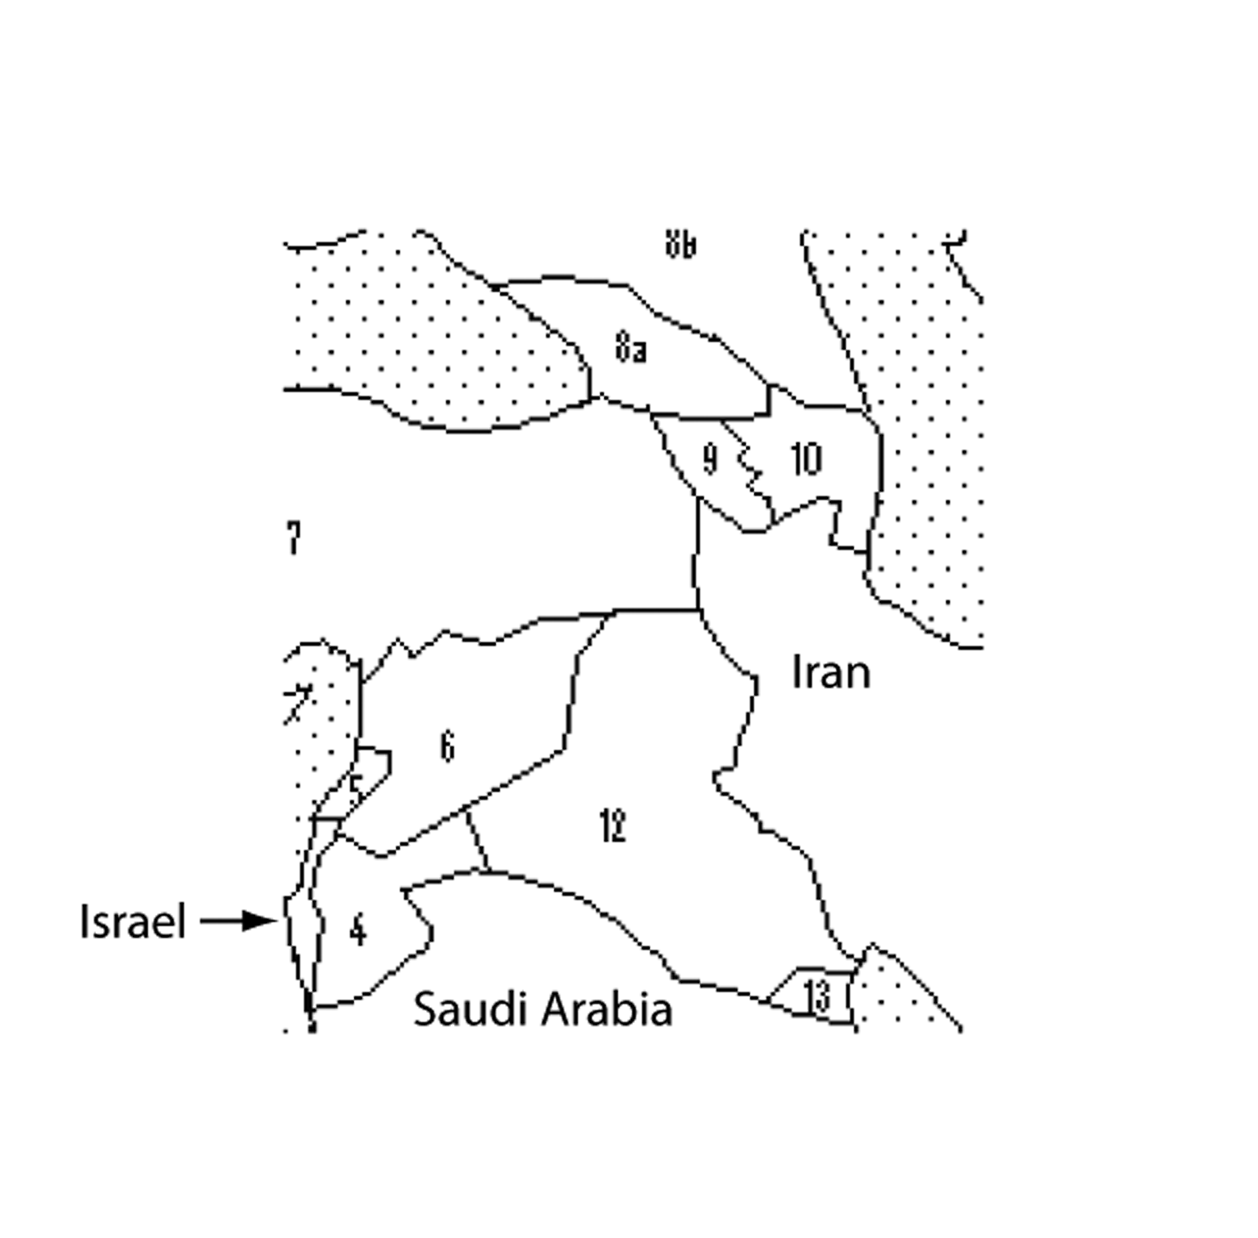
(For your reference and edification, the numbered countries are 4-Jordan, 5-Lebanon, 6-Syria, 7-Turkey, 8a-Georgia, 8b-Russia, 9-Armenia, 10-Azerbaijan, 12-Iraq, 13-Kuwait)
(image from http://catholic-resources.org/Courses/SCTR19-Spring2007-Worksheets.htm)
Color the map using as few colors as possible.
(If you don’t have markers, just write the name of
the color or use shading.)
Kim is figuring out the schedule for next year. It’s tough, because out of thirteen electives, several students have expressed interest in taking more than one of them. She doesn’t want to schedule two classes in the same block if there are students who want to take both of those classes.
In the grid below, an “x” indicates that at least one student has expressed an interest in taking both classes in that row and column of the grid.
|
Poetry |
Adv calc |
Crim law |
Foren. |
Pract. |
Stat |
Prod. |
Animal behavior |
Civ. Lib. |
Java |
Shakespeare |
Astro |
Discrete |
|
|
Poetry |
x |
x |
x |
||||||||||
|
Adv Calc |
x |
x |
|||||||||||
|
Crim Law |
x |
x |
x |
x |
|||||||||
|
Forensics |
x |
x |
x |
x |
x |
||||||||
|
Practicum |
x |
x |
x |
x |
x |
x |
|||||||
|
Stat |
x |
x |
x |
||||||||||
|
Production |
x |
x |
|||||||||||
|
Animal |
x |
x |
x |
x |
|||||||||
|
Civ Lib |
x |
x |
x |
x |
|||||||||
|
Java |
x |
x |
x |
x |
|||||||||
|
Shakespeare |
x |
x |
x |
x |
x |
||||||||
|
Astro |
x |
x |
x |
x |
|||||||||
|
Discrete |
x |
x |
Assign each class a block (A through F) so that you never put two classes in the same block if there’s anyone who wants to take both classes.
Now, suppose that all of these electives are to be scheduled on an ABC day. Can Kim create a successful, conflict-free schedule with only three blocks? If not, what is the fewest number of blocks that would accommodate these electives?
Development
To determine Felix’s driving route, you probably recognized a way to represent the situation visually — whether you sketched out a map or drew a diagram.
The second and third problems, however, didn’t have an obvious new representation to apply. Some people probably applied labels; others may have made lists. It turns out, though, if we use the method of the first problem with the second and third, we can learn much more from the data!
Most likely, the diagram you used in the first problem was actually a graph. A graph, in its most general sense, is a collection of dots (called “nodes”) and lines connecting them (called “edges”). In your graph of Felix’s problem, the nodes represented cities, and the edges related the nodes by showing the distances between.
We can represent the second situation with a graph, too, if we let each country be represented by a node. We can draw an edge between nodes when those countries border each other. Our graph comes out to look like this:
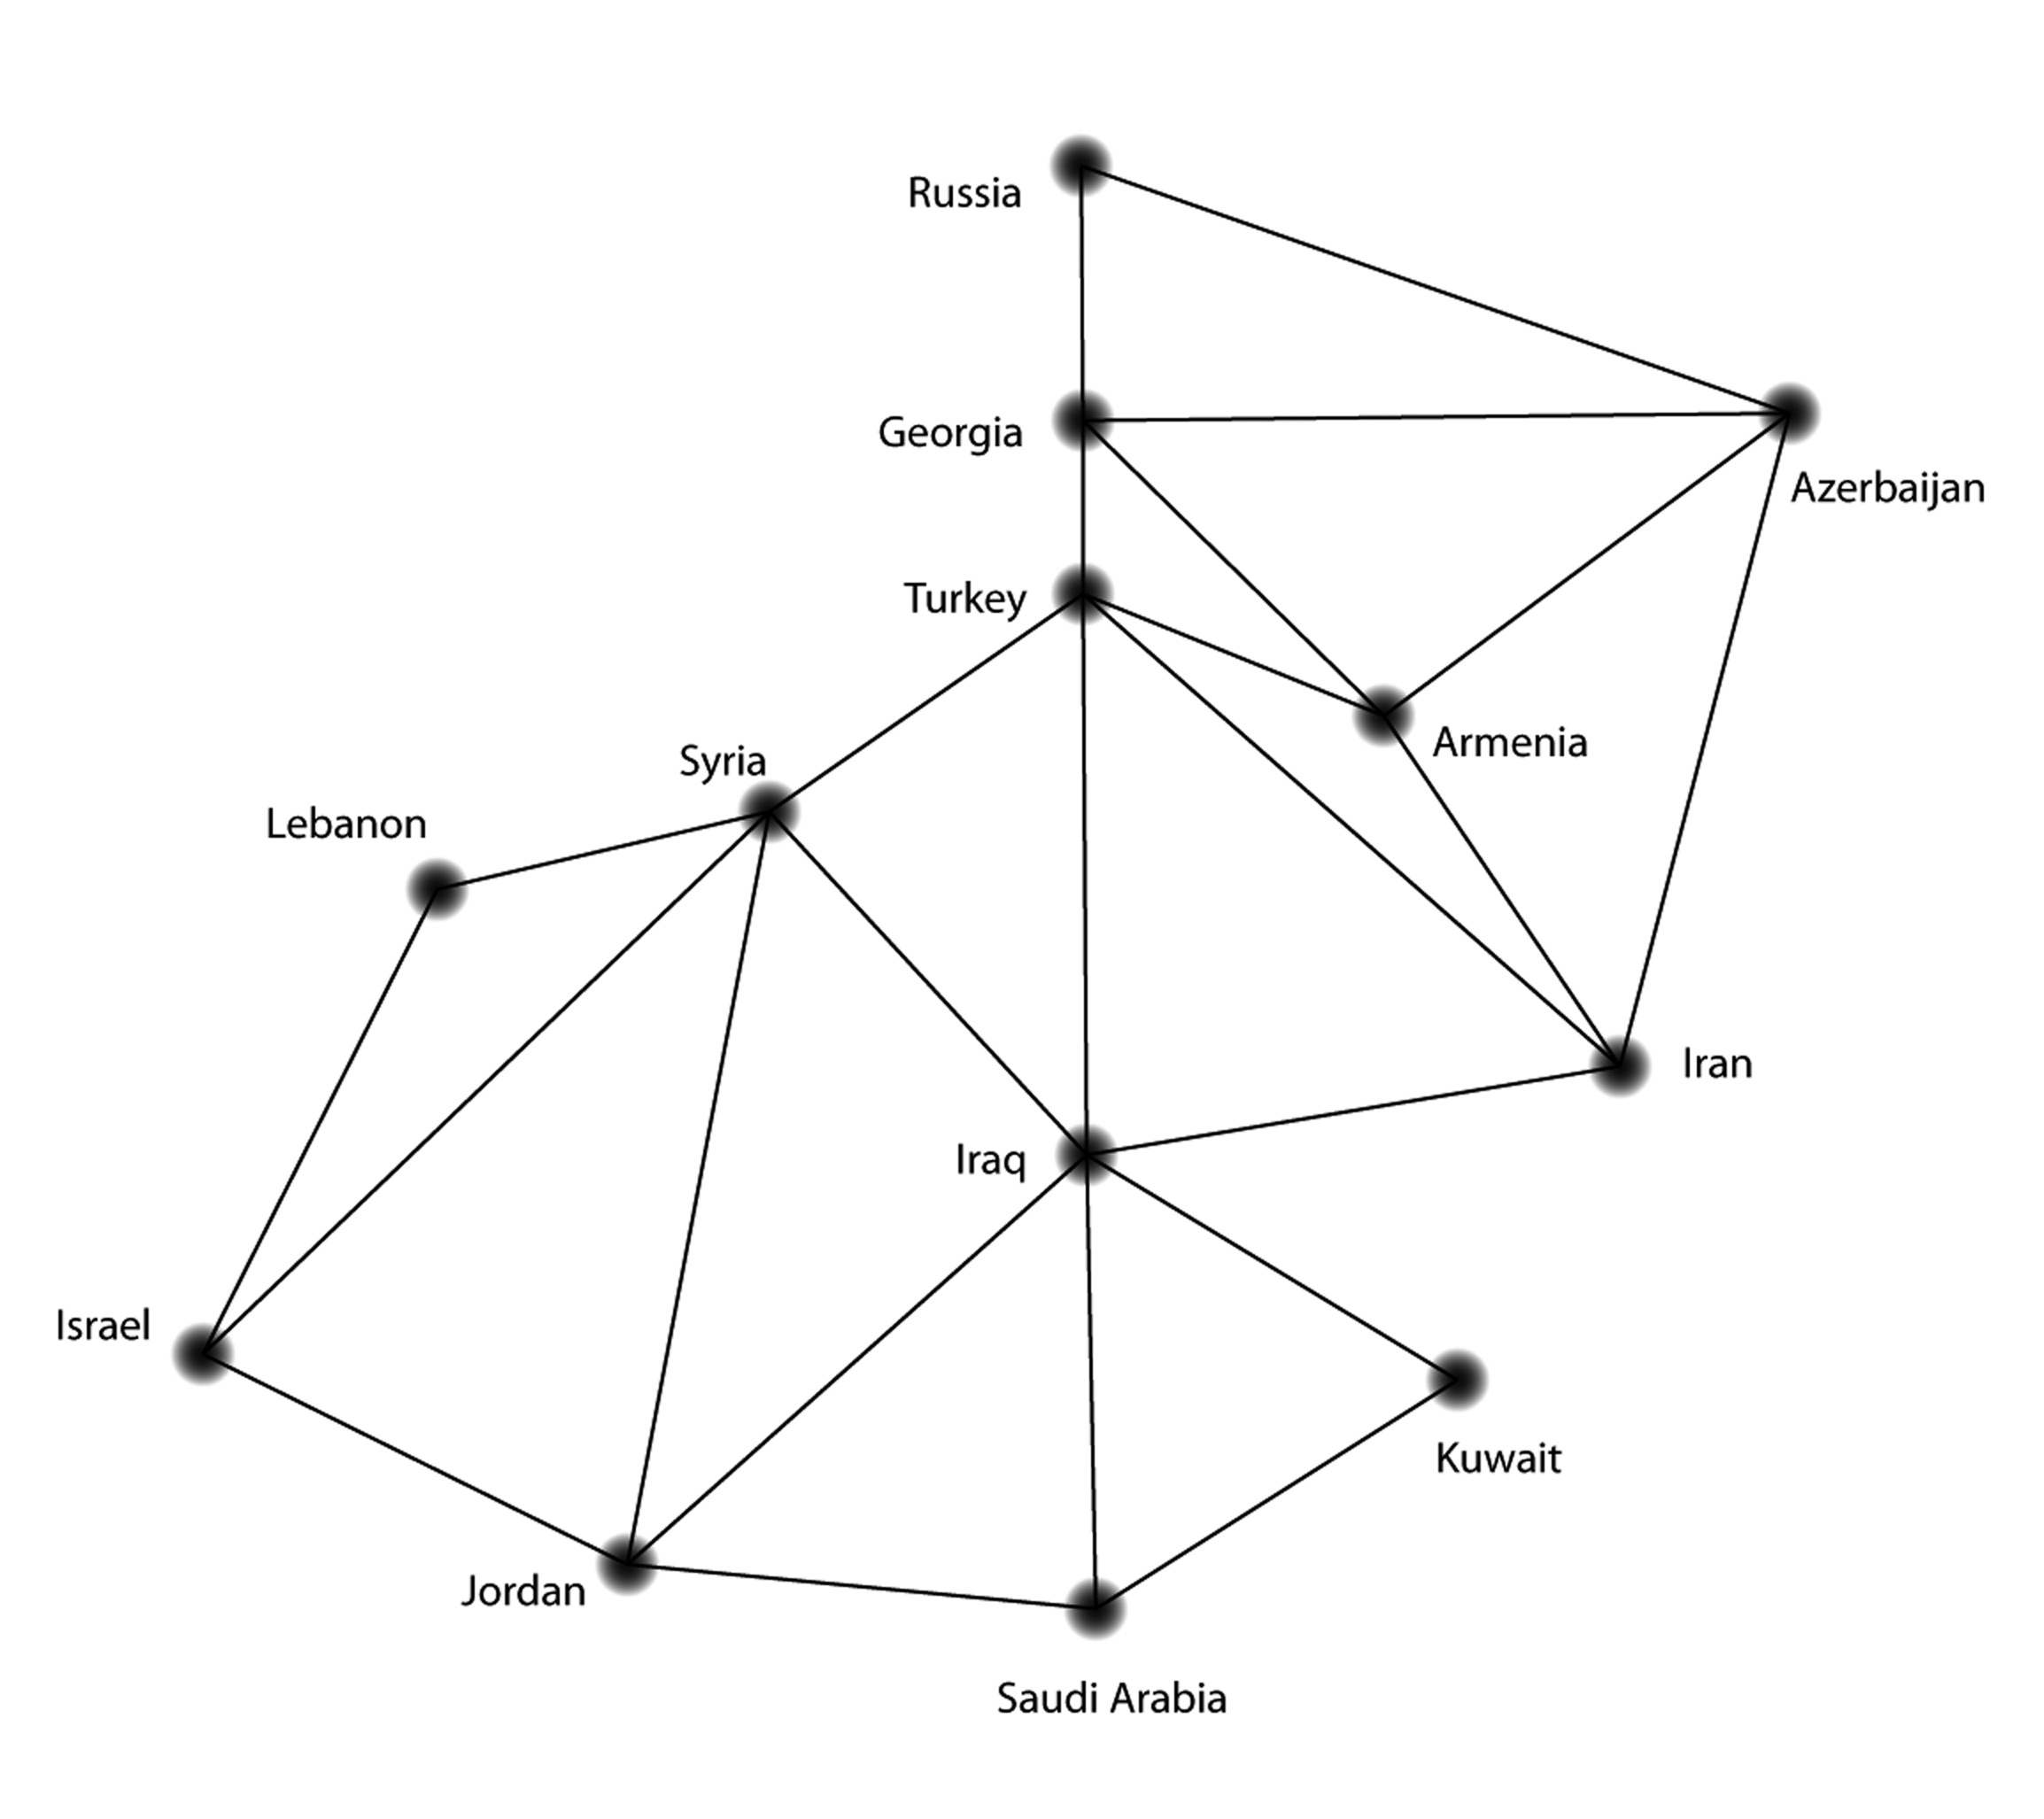
The problem now becomes to color each dot in such a way that any two dots connected by lines are always different colors.
What is the minimum number of colors you need now?
Did you think this version of the “coloring” problem was easier than in the introduction? Why or why not?
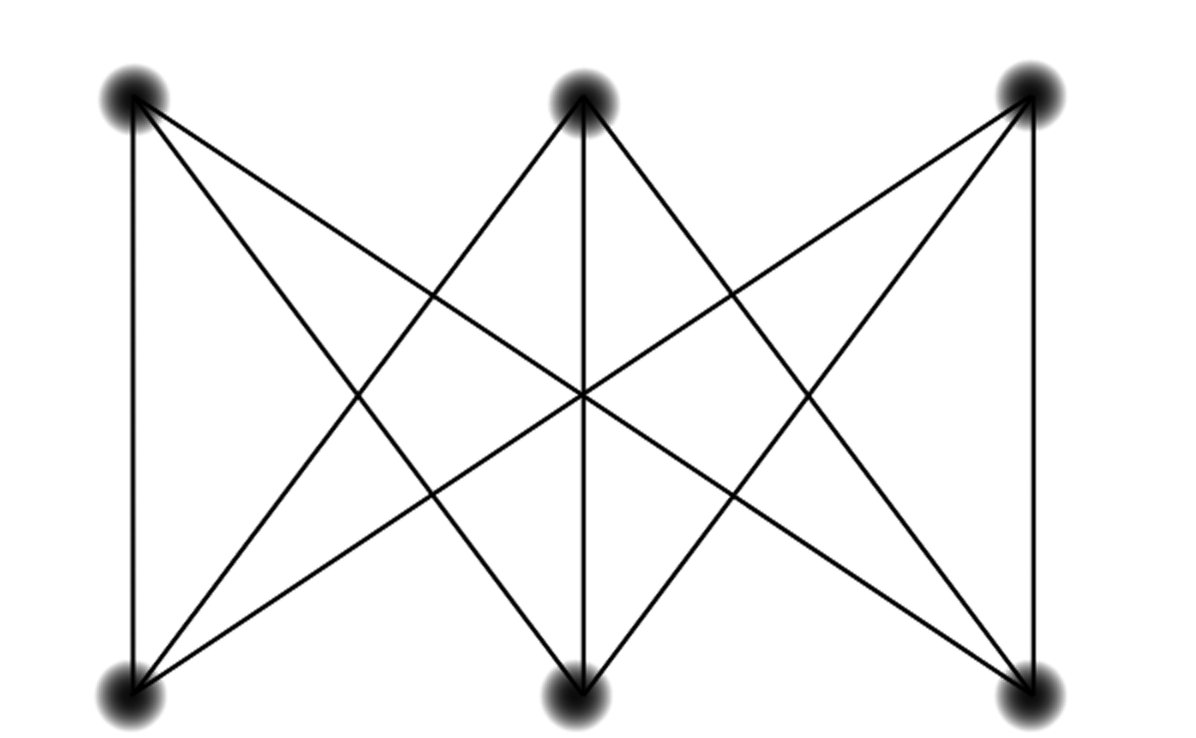
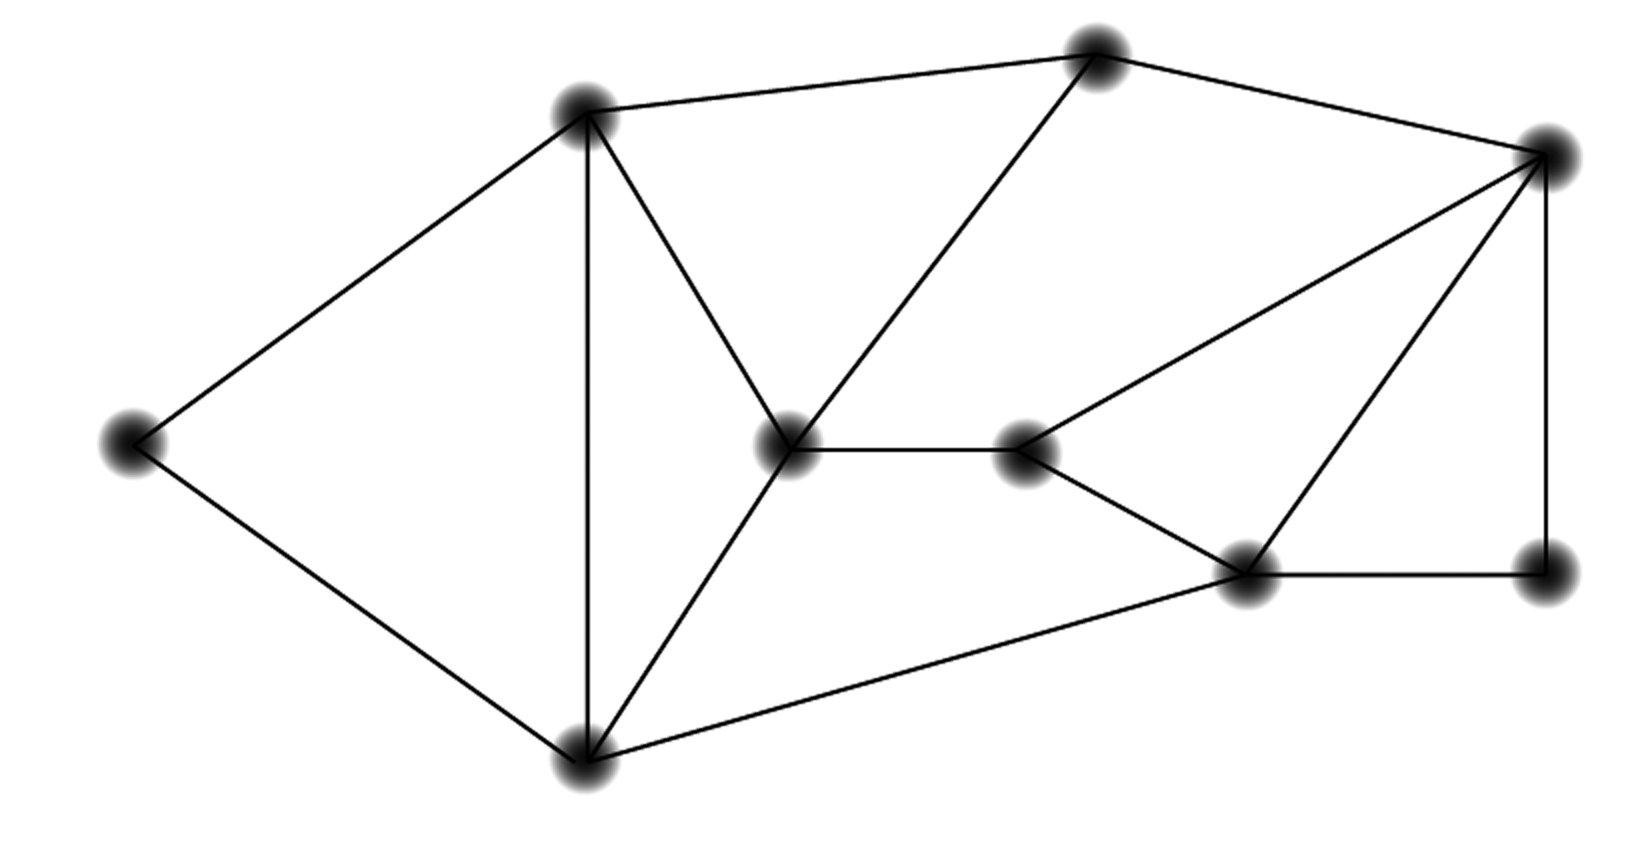
Similarly, we can represent the scheduling problem as a graph. The nodes can represent classes, and an edge can connect the nodes in the cases where some student wants to take both classes, as in the figure below.
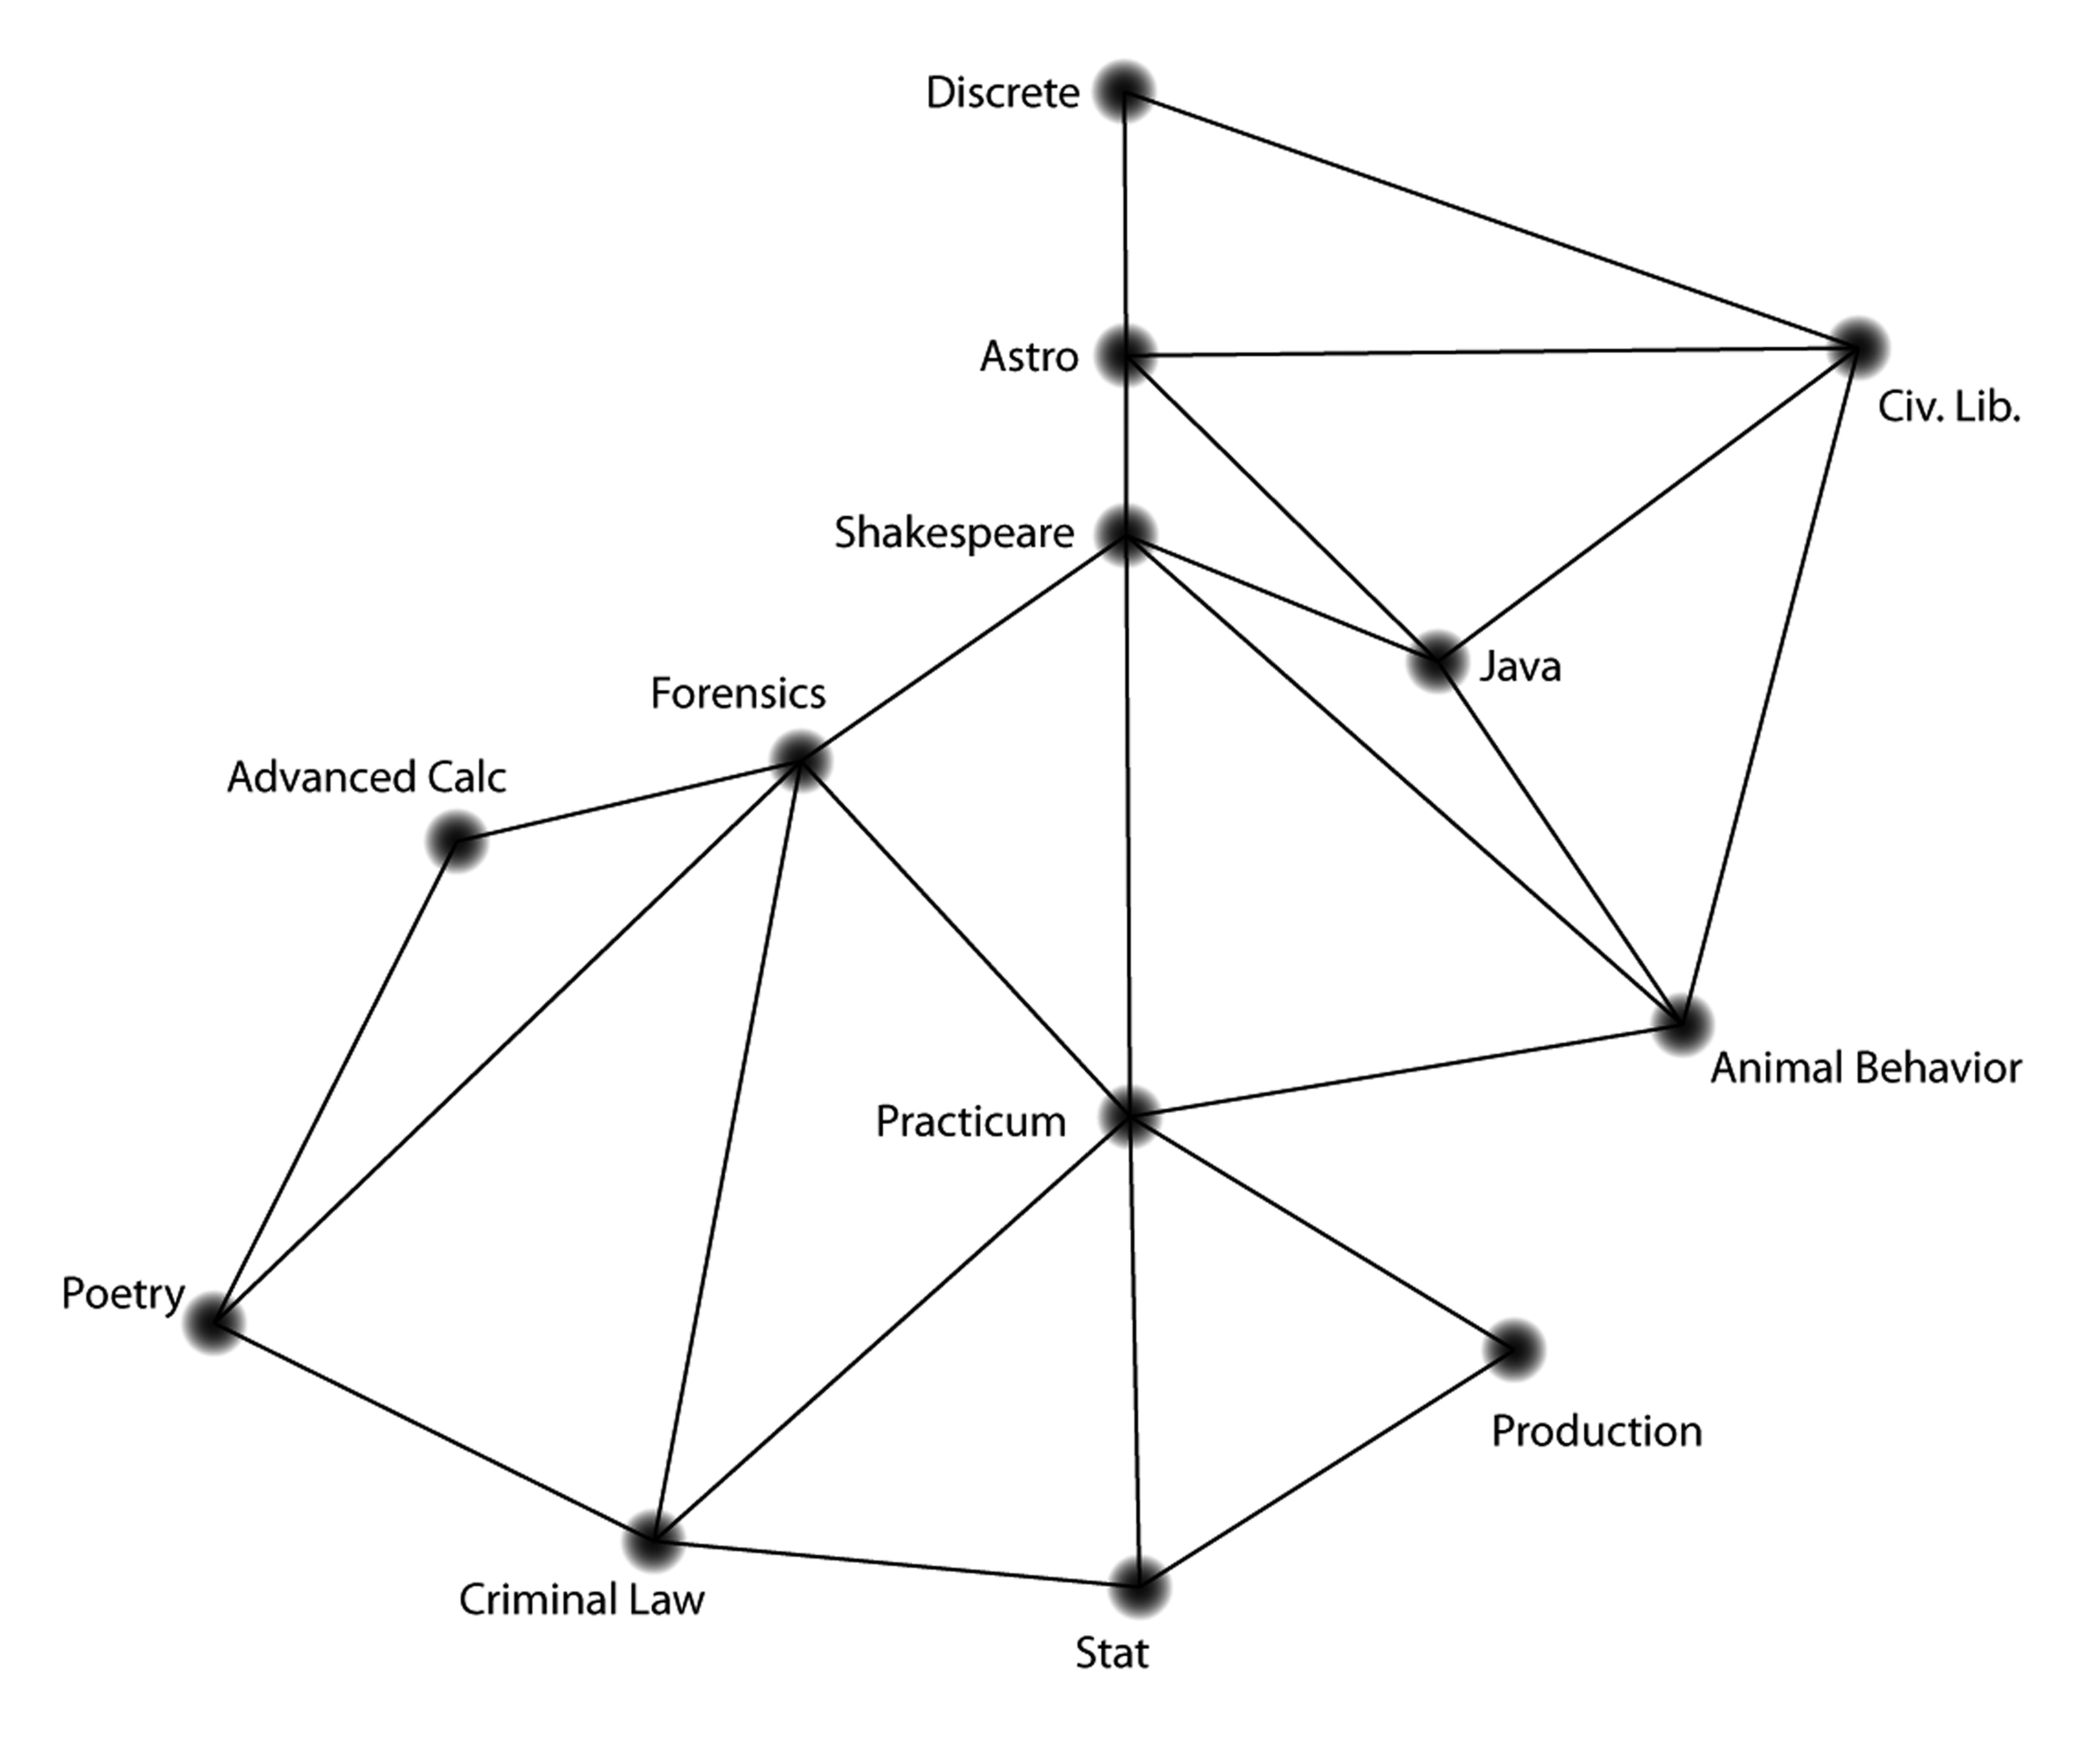
Solve the scheduling problem using this representation. What minimum number of blocks can you identify now?
Was this version of the schedule problem easier than in the introduction? Why or why not?
The tools you have been using so far in this lesson are the tools of graph theory. Already, graph theory has been über-useful in helping us represent relationships in a very streamlined way. What’s more, we can now see that the map-coloring problem and the scheduling problem — initially very different — are actually remarkably similar.
In fact, the identically structured graphs of the map-coloring problem and the scheduling problem are isomorphic. Two graphs are isomorphic when each node in one graph has a “partner” node in the other — a “partner” with the same connections. For example, Georgia in the first graph and Astronomy in the second correspond to one another. So do Lebanon and Advanced Calc. This correspondence comes from their identically structured connections, not their actual position on the page.
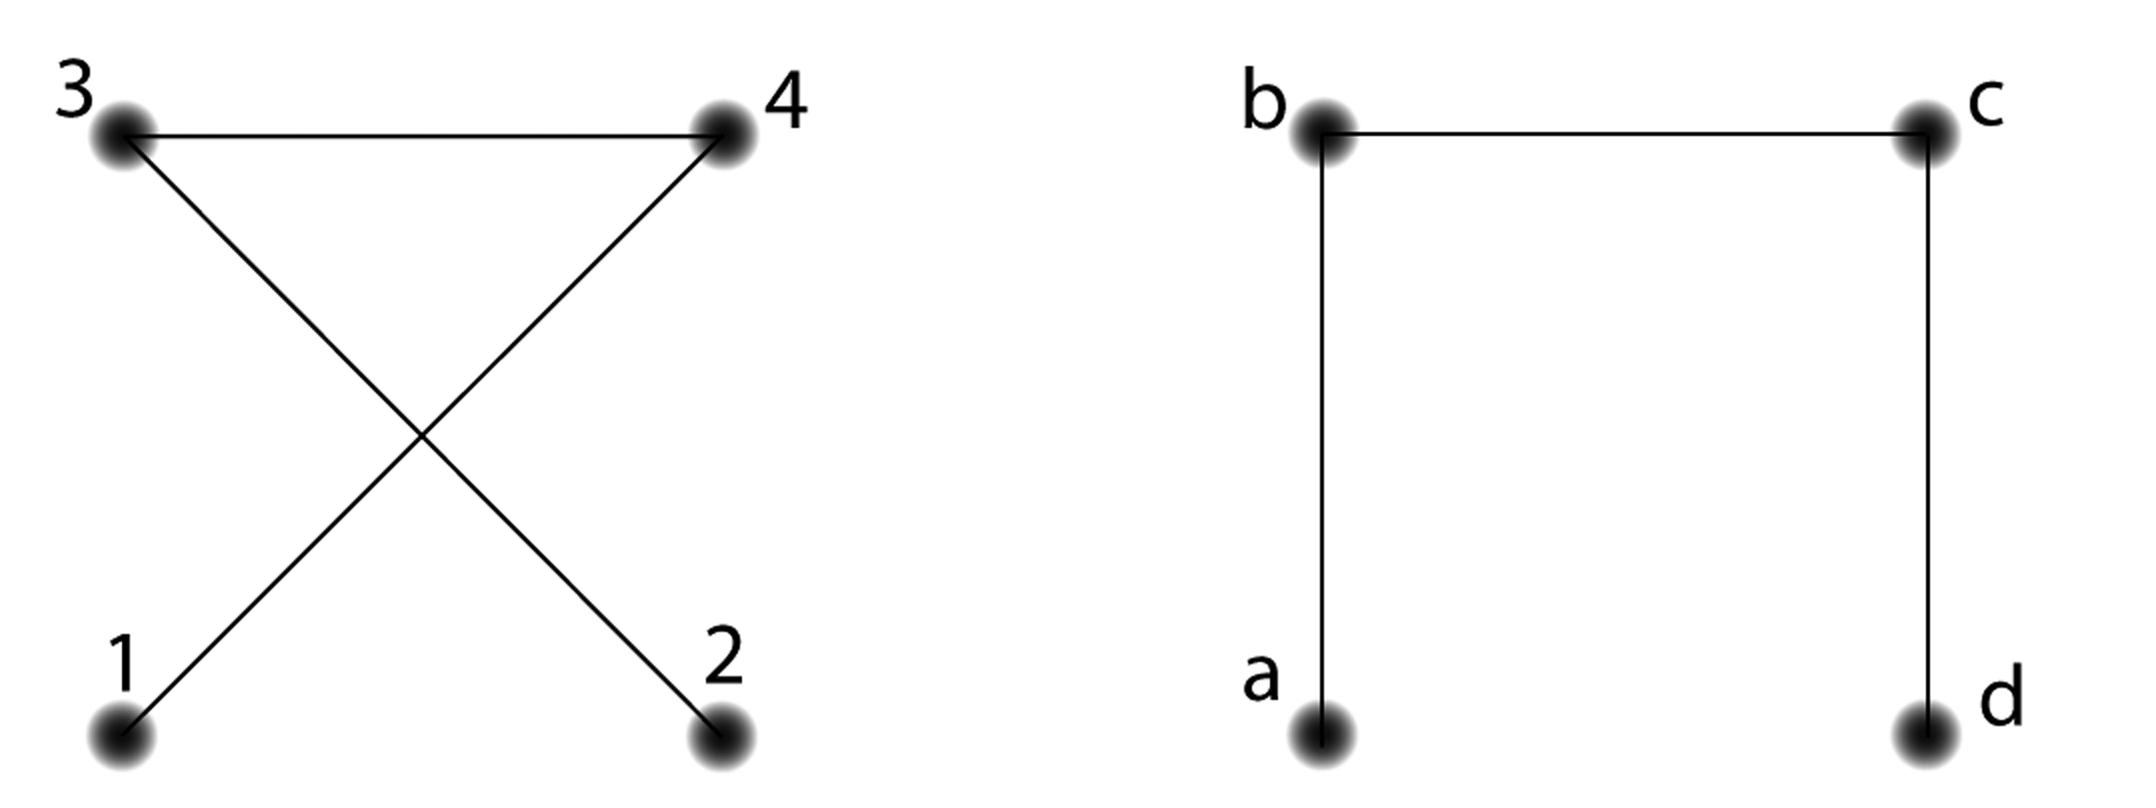
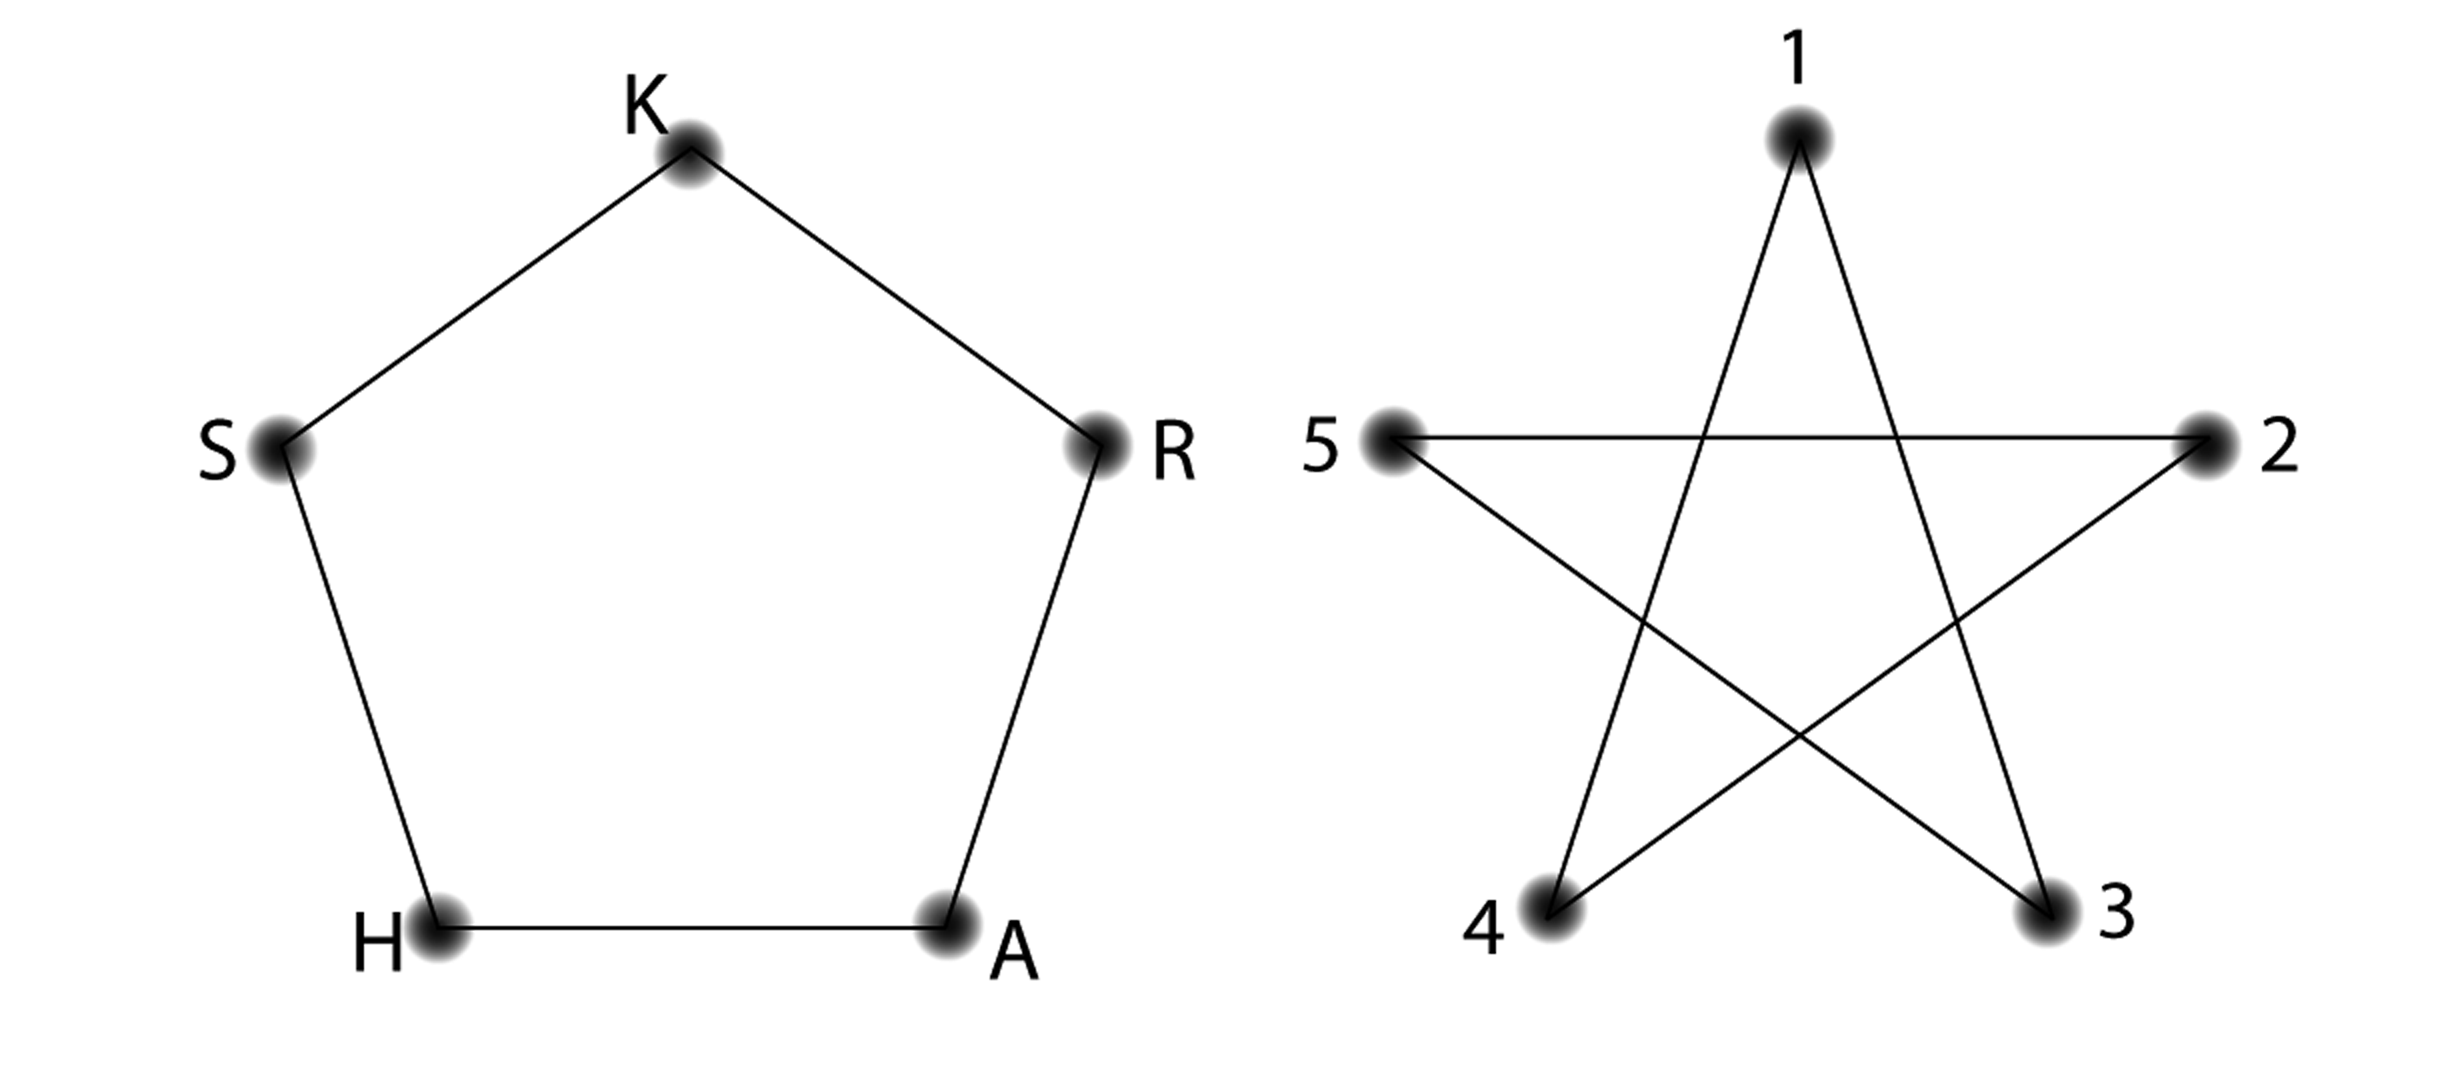
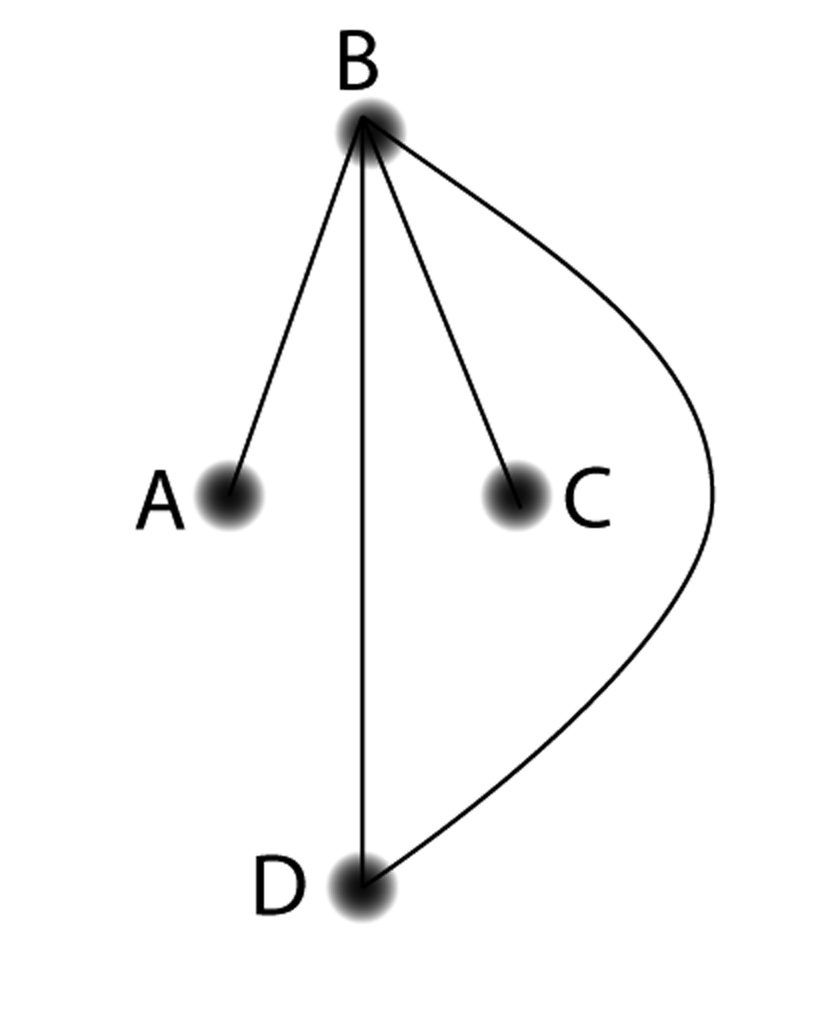
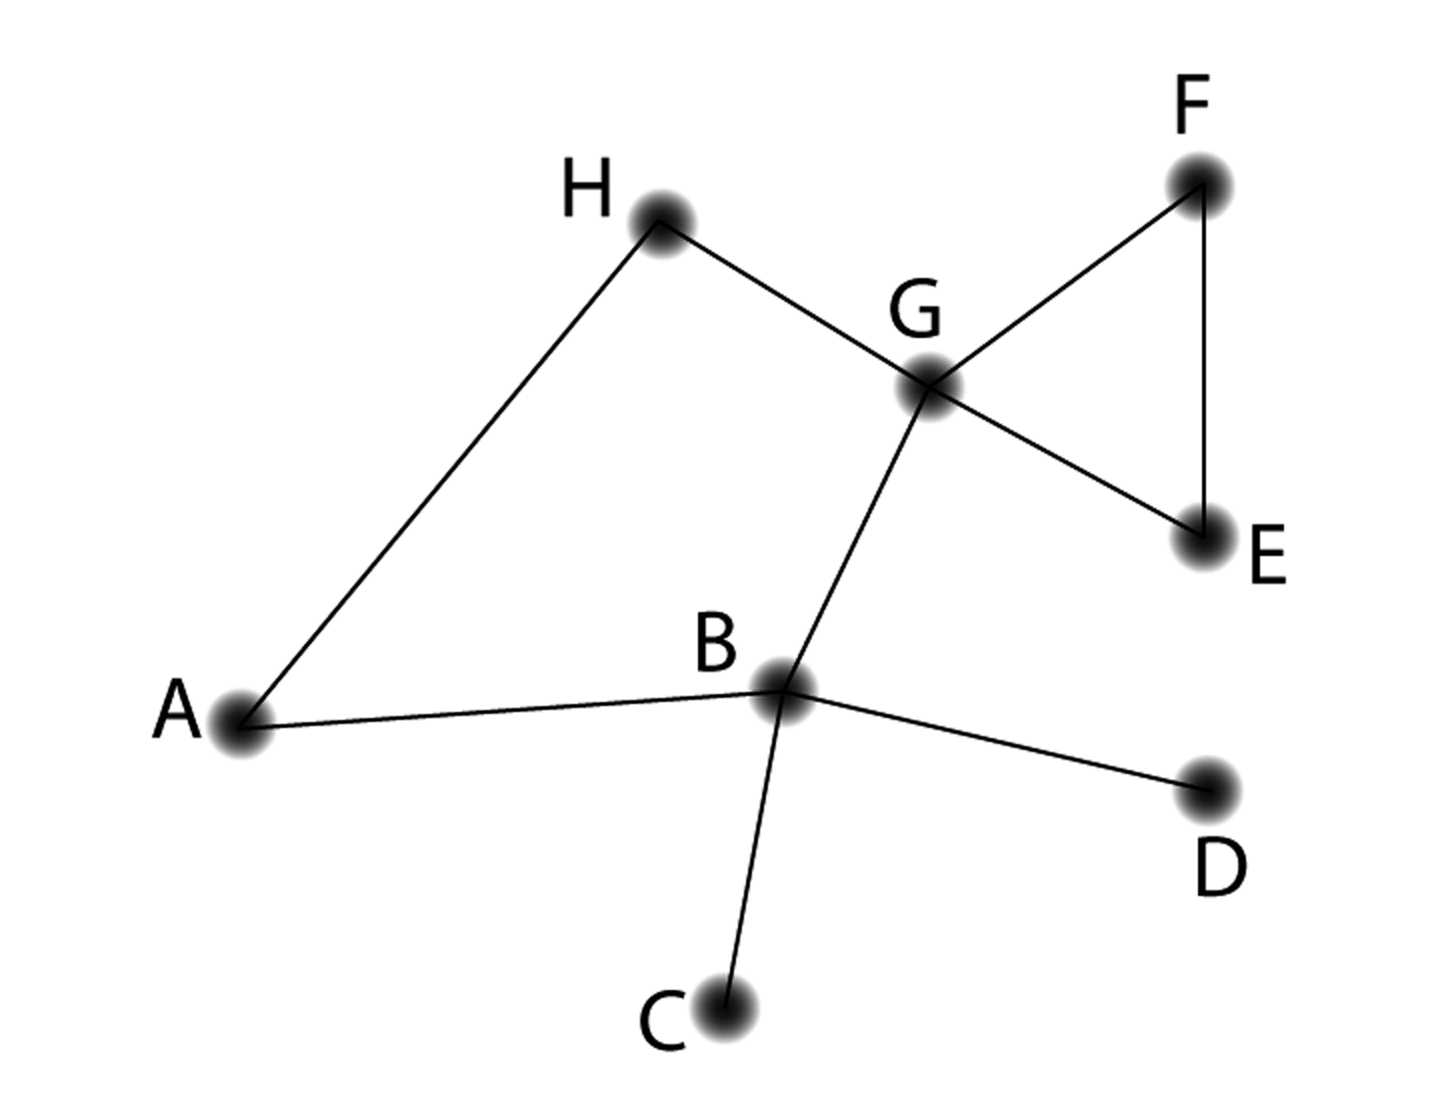
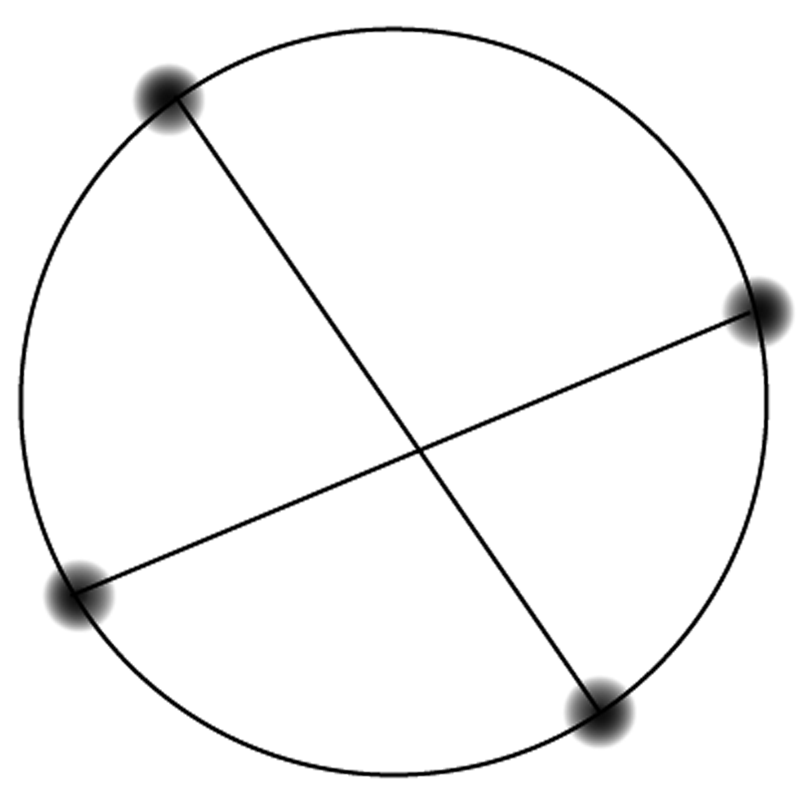
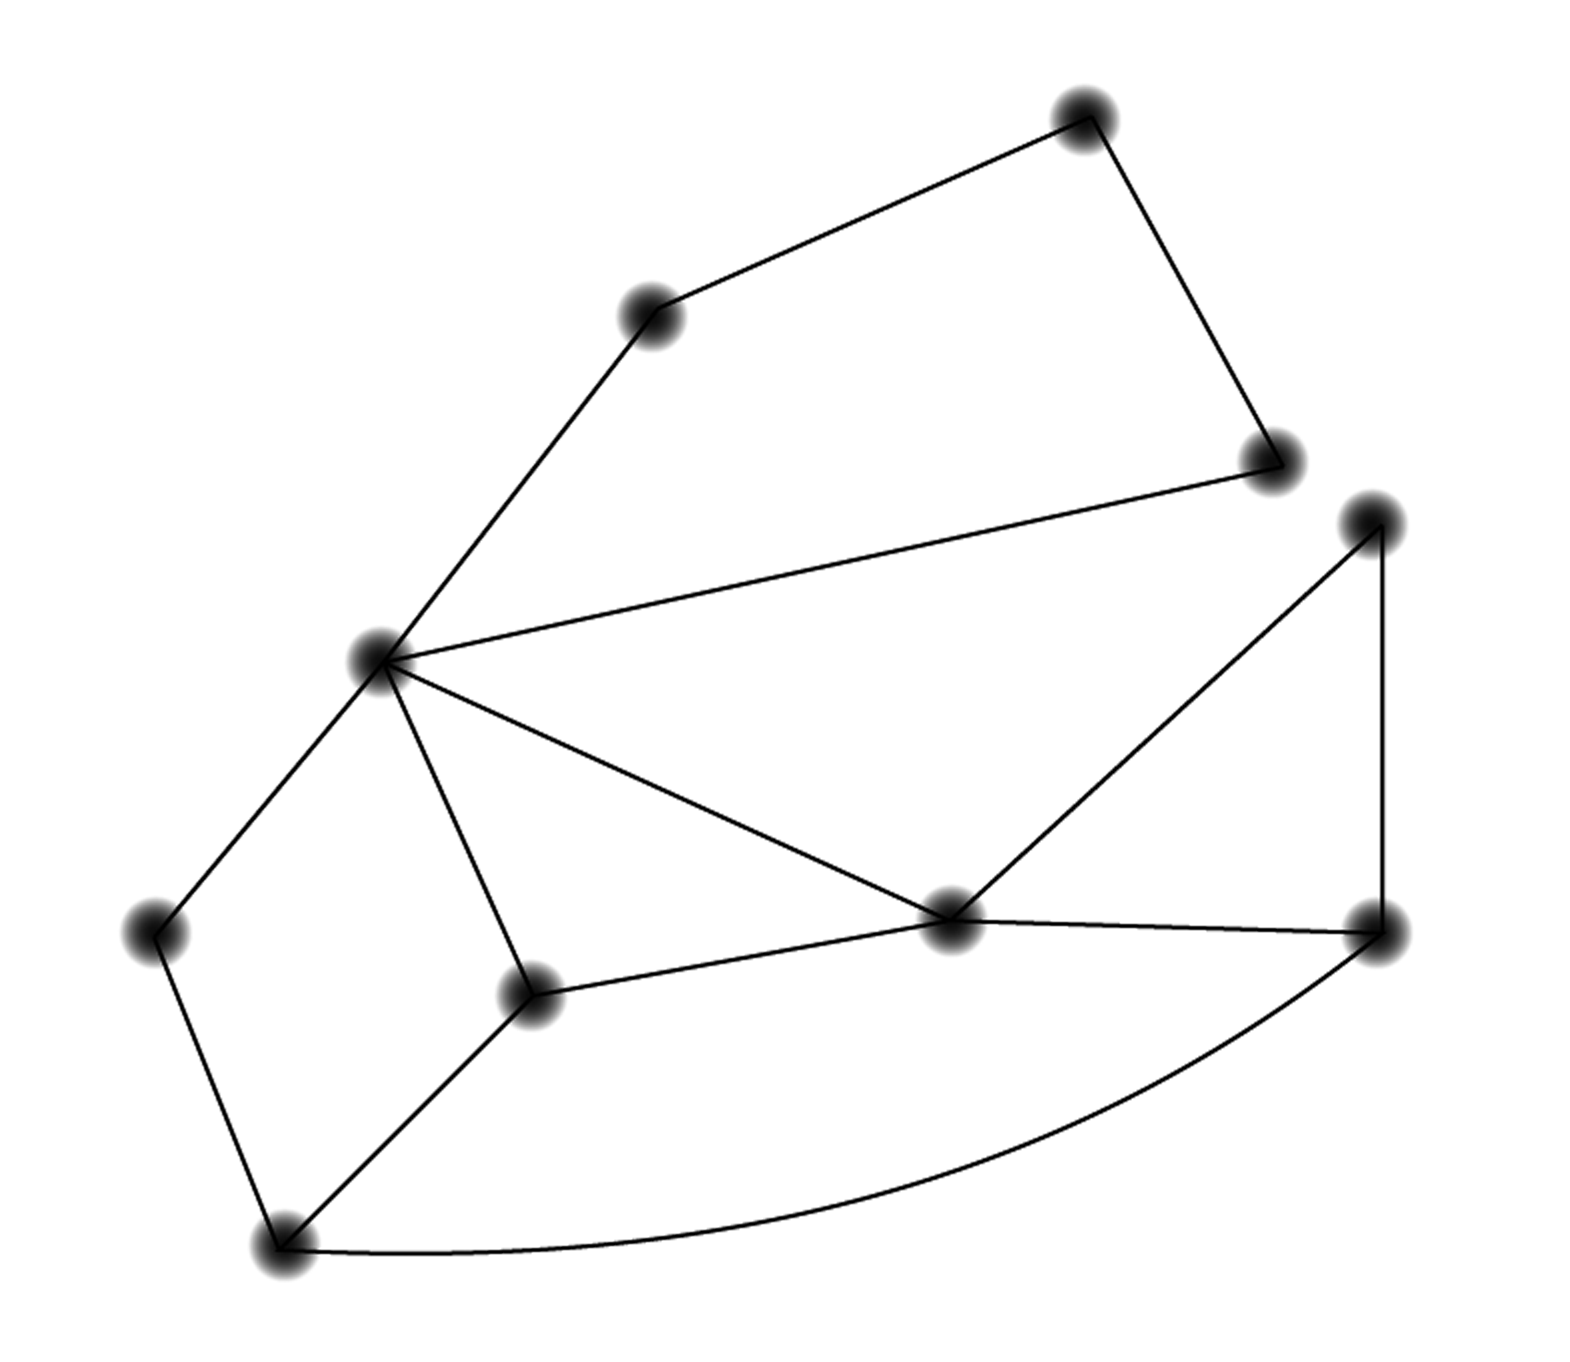
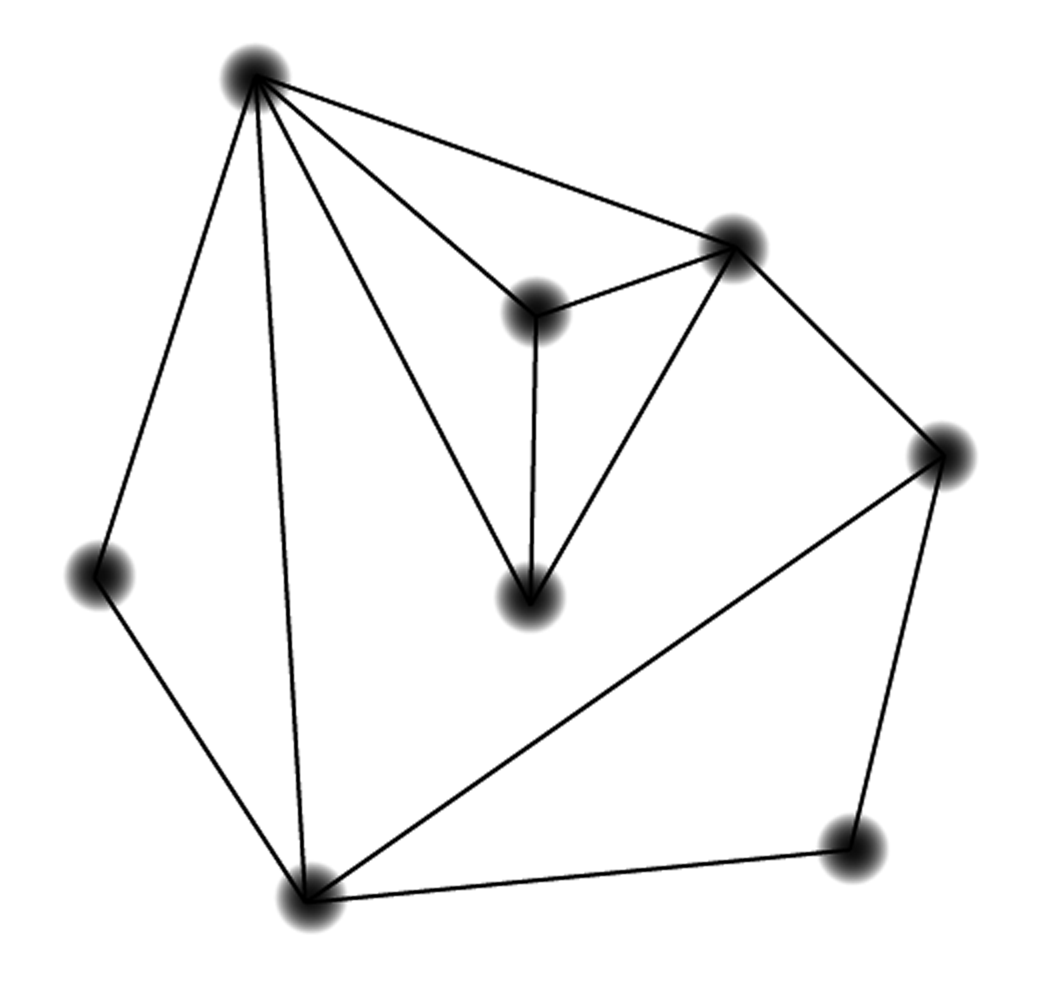
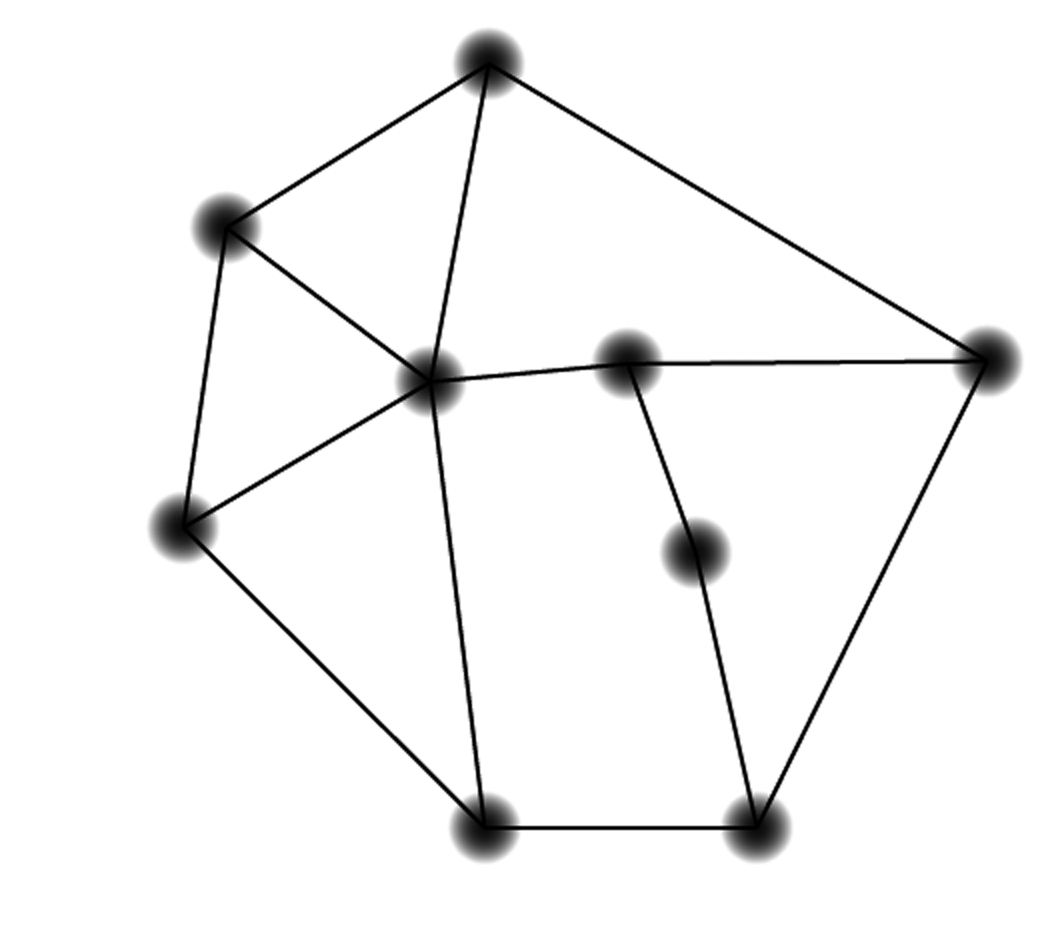
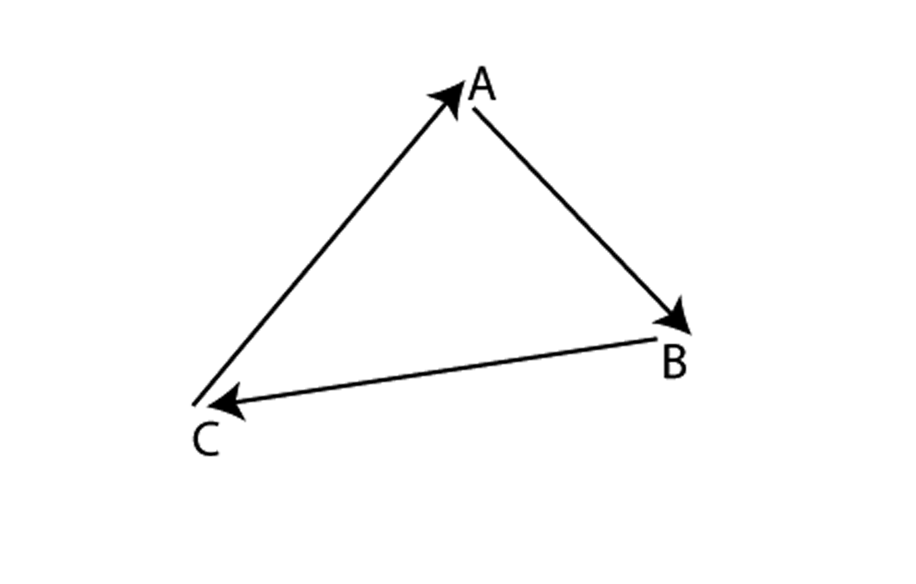
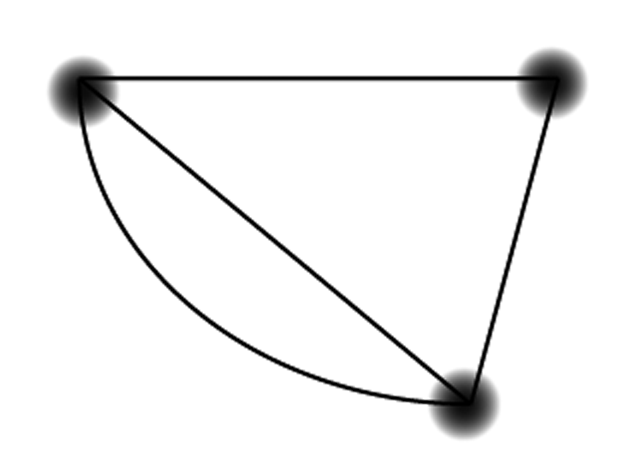
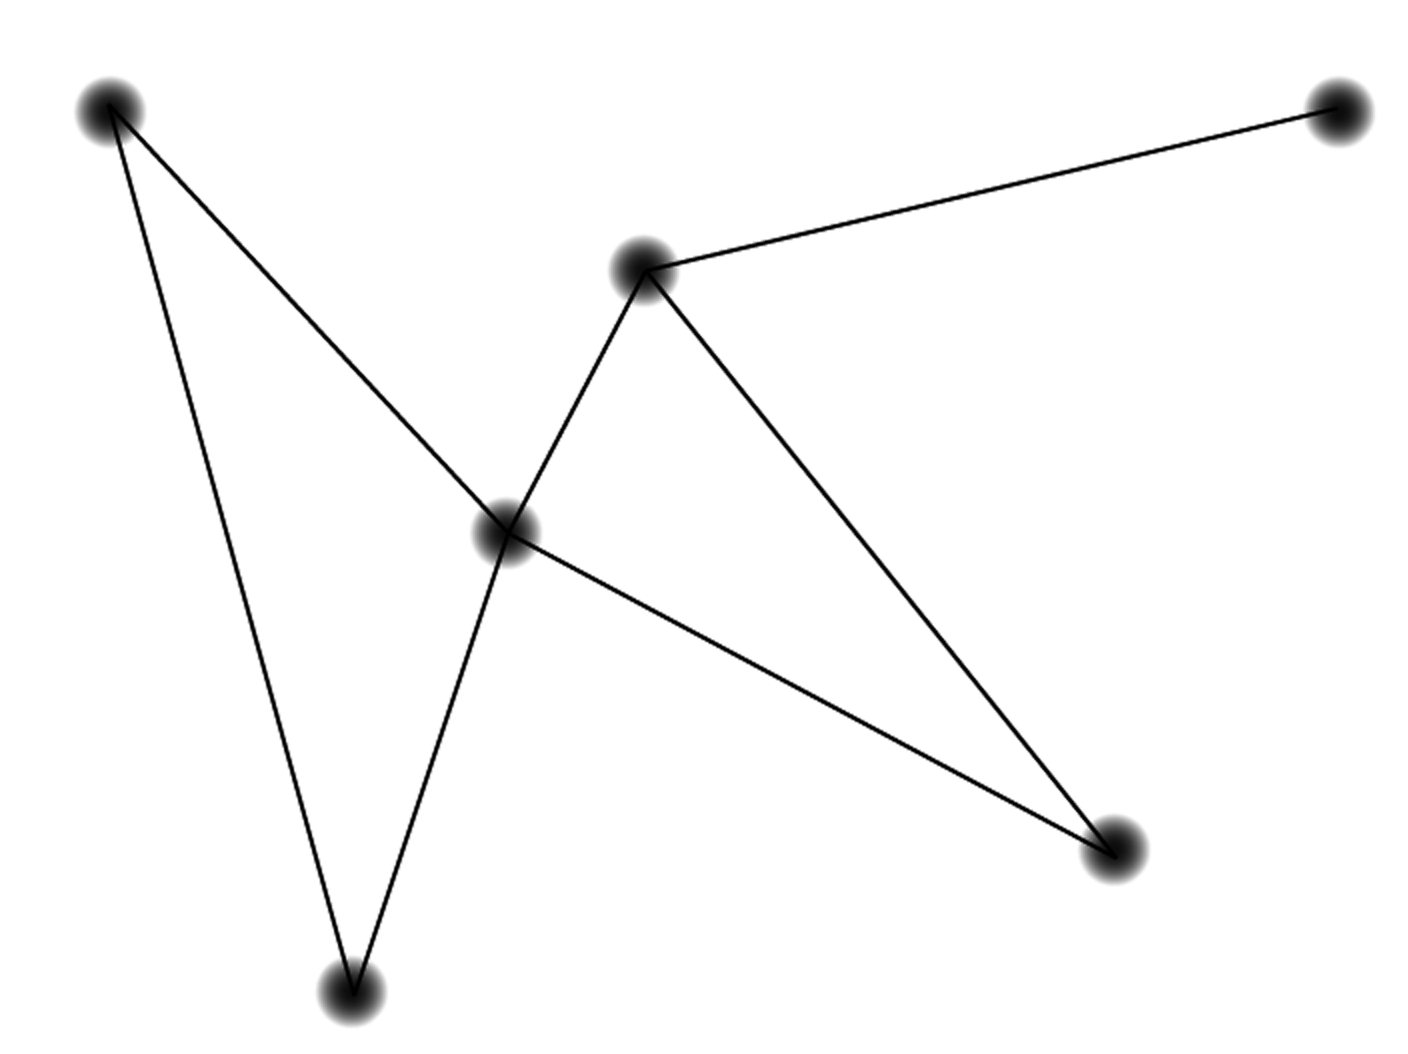
The following two graphs are not isomorphic.
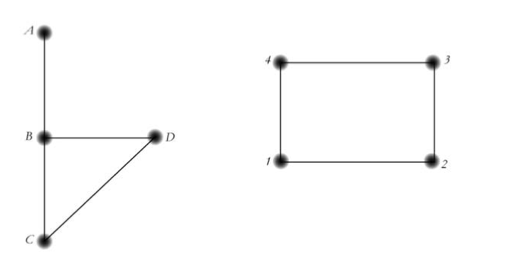
An easy way to see that the graphs are not isomorphic is to see that node B has no “partner.” In the left hand graph, B has three edges coming out of it. On the right, no node has three edges coming out of it, so B has no possible “partner.” The number of edges connected to a node is a very important characteristic. The degree of a node (abbreviated deg(n)) is the number of edges coming out of it. So in the left-hand graph deg(A) = 1 and deg(B) = 3. What is deg(C)?
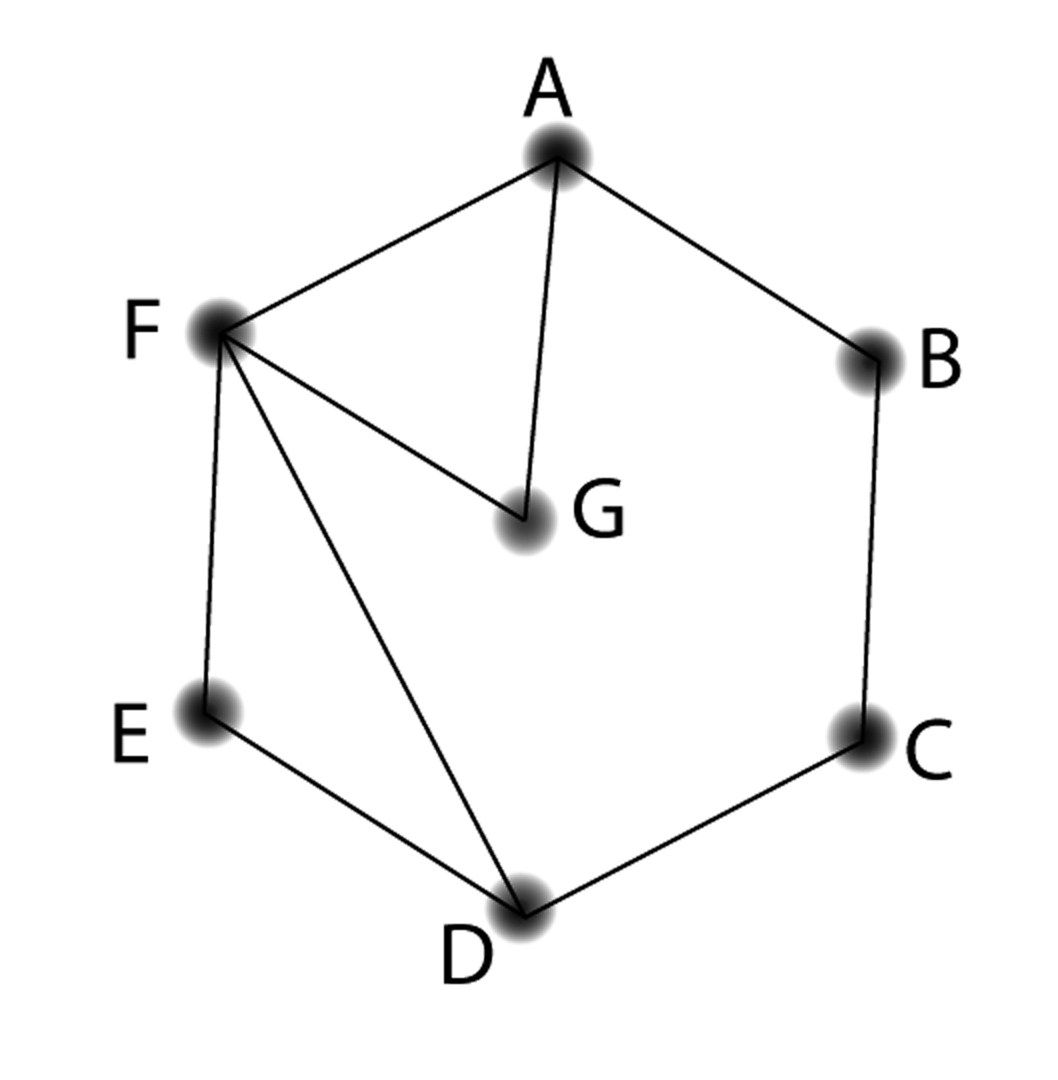
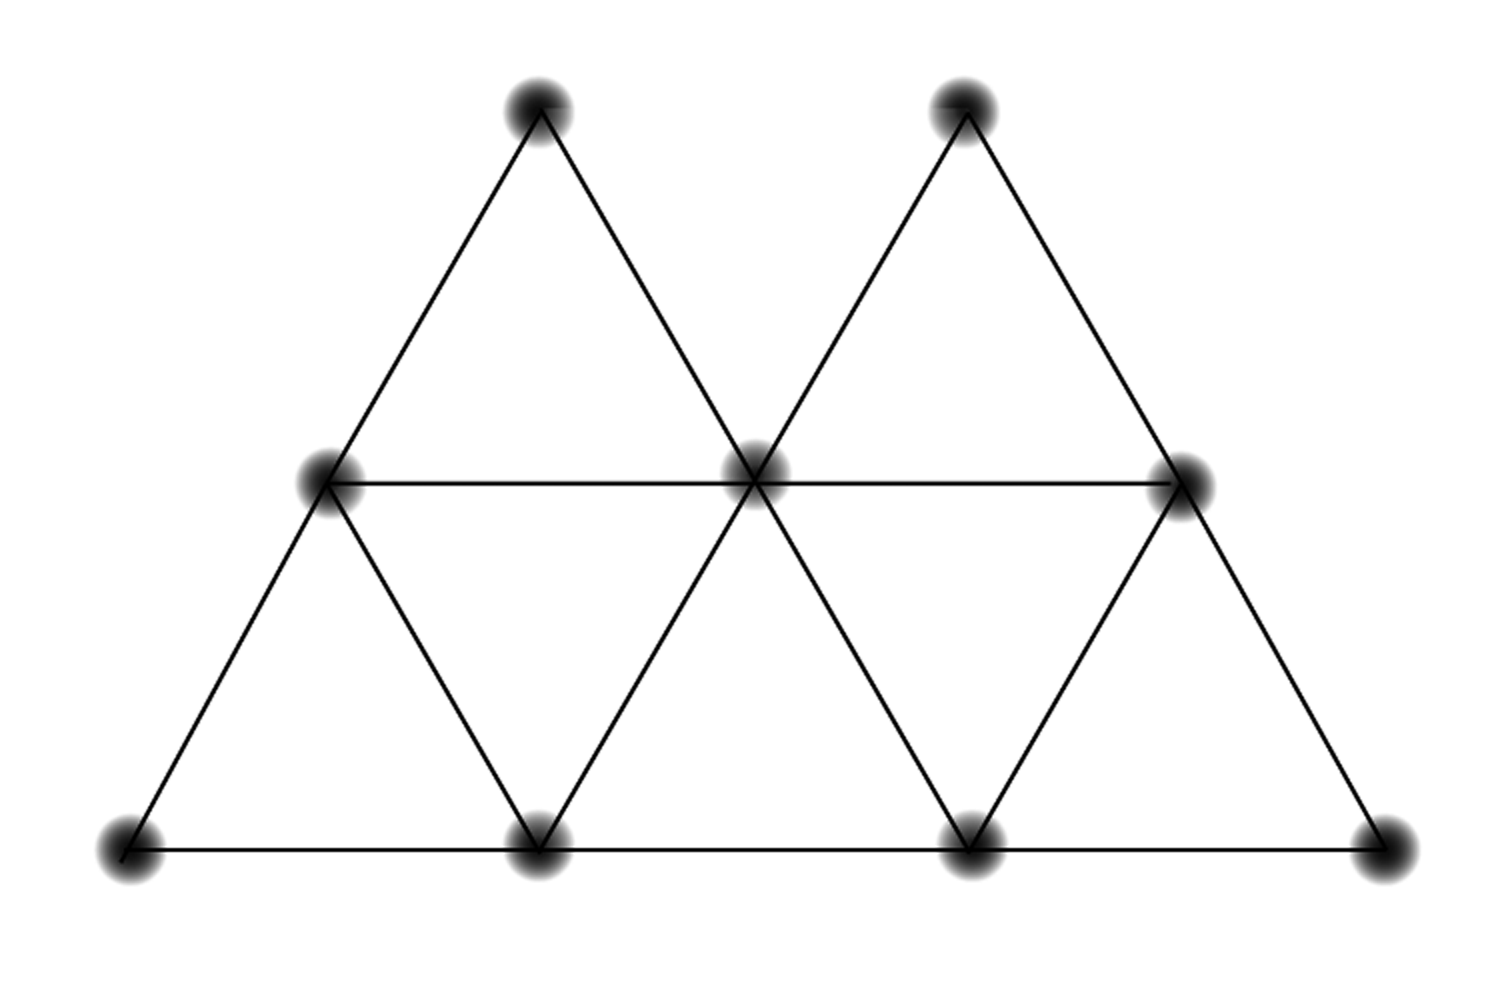
Isomorphisms can be trickier to spot than we’ve seen so far. For example, someone else with the task of drawing the scheduling graph might have come up with the following:
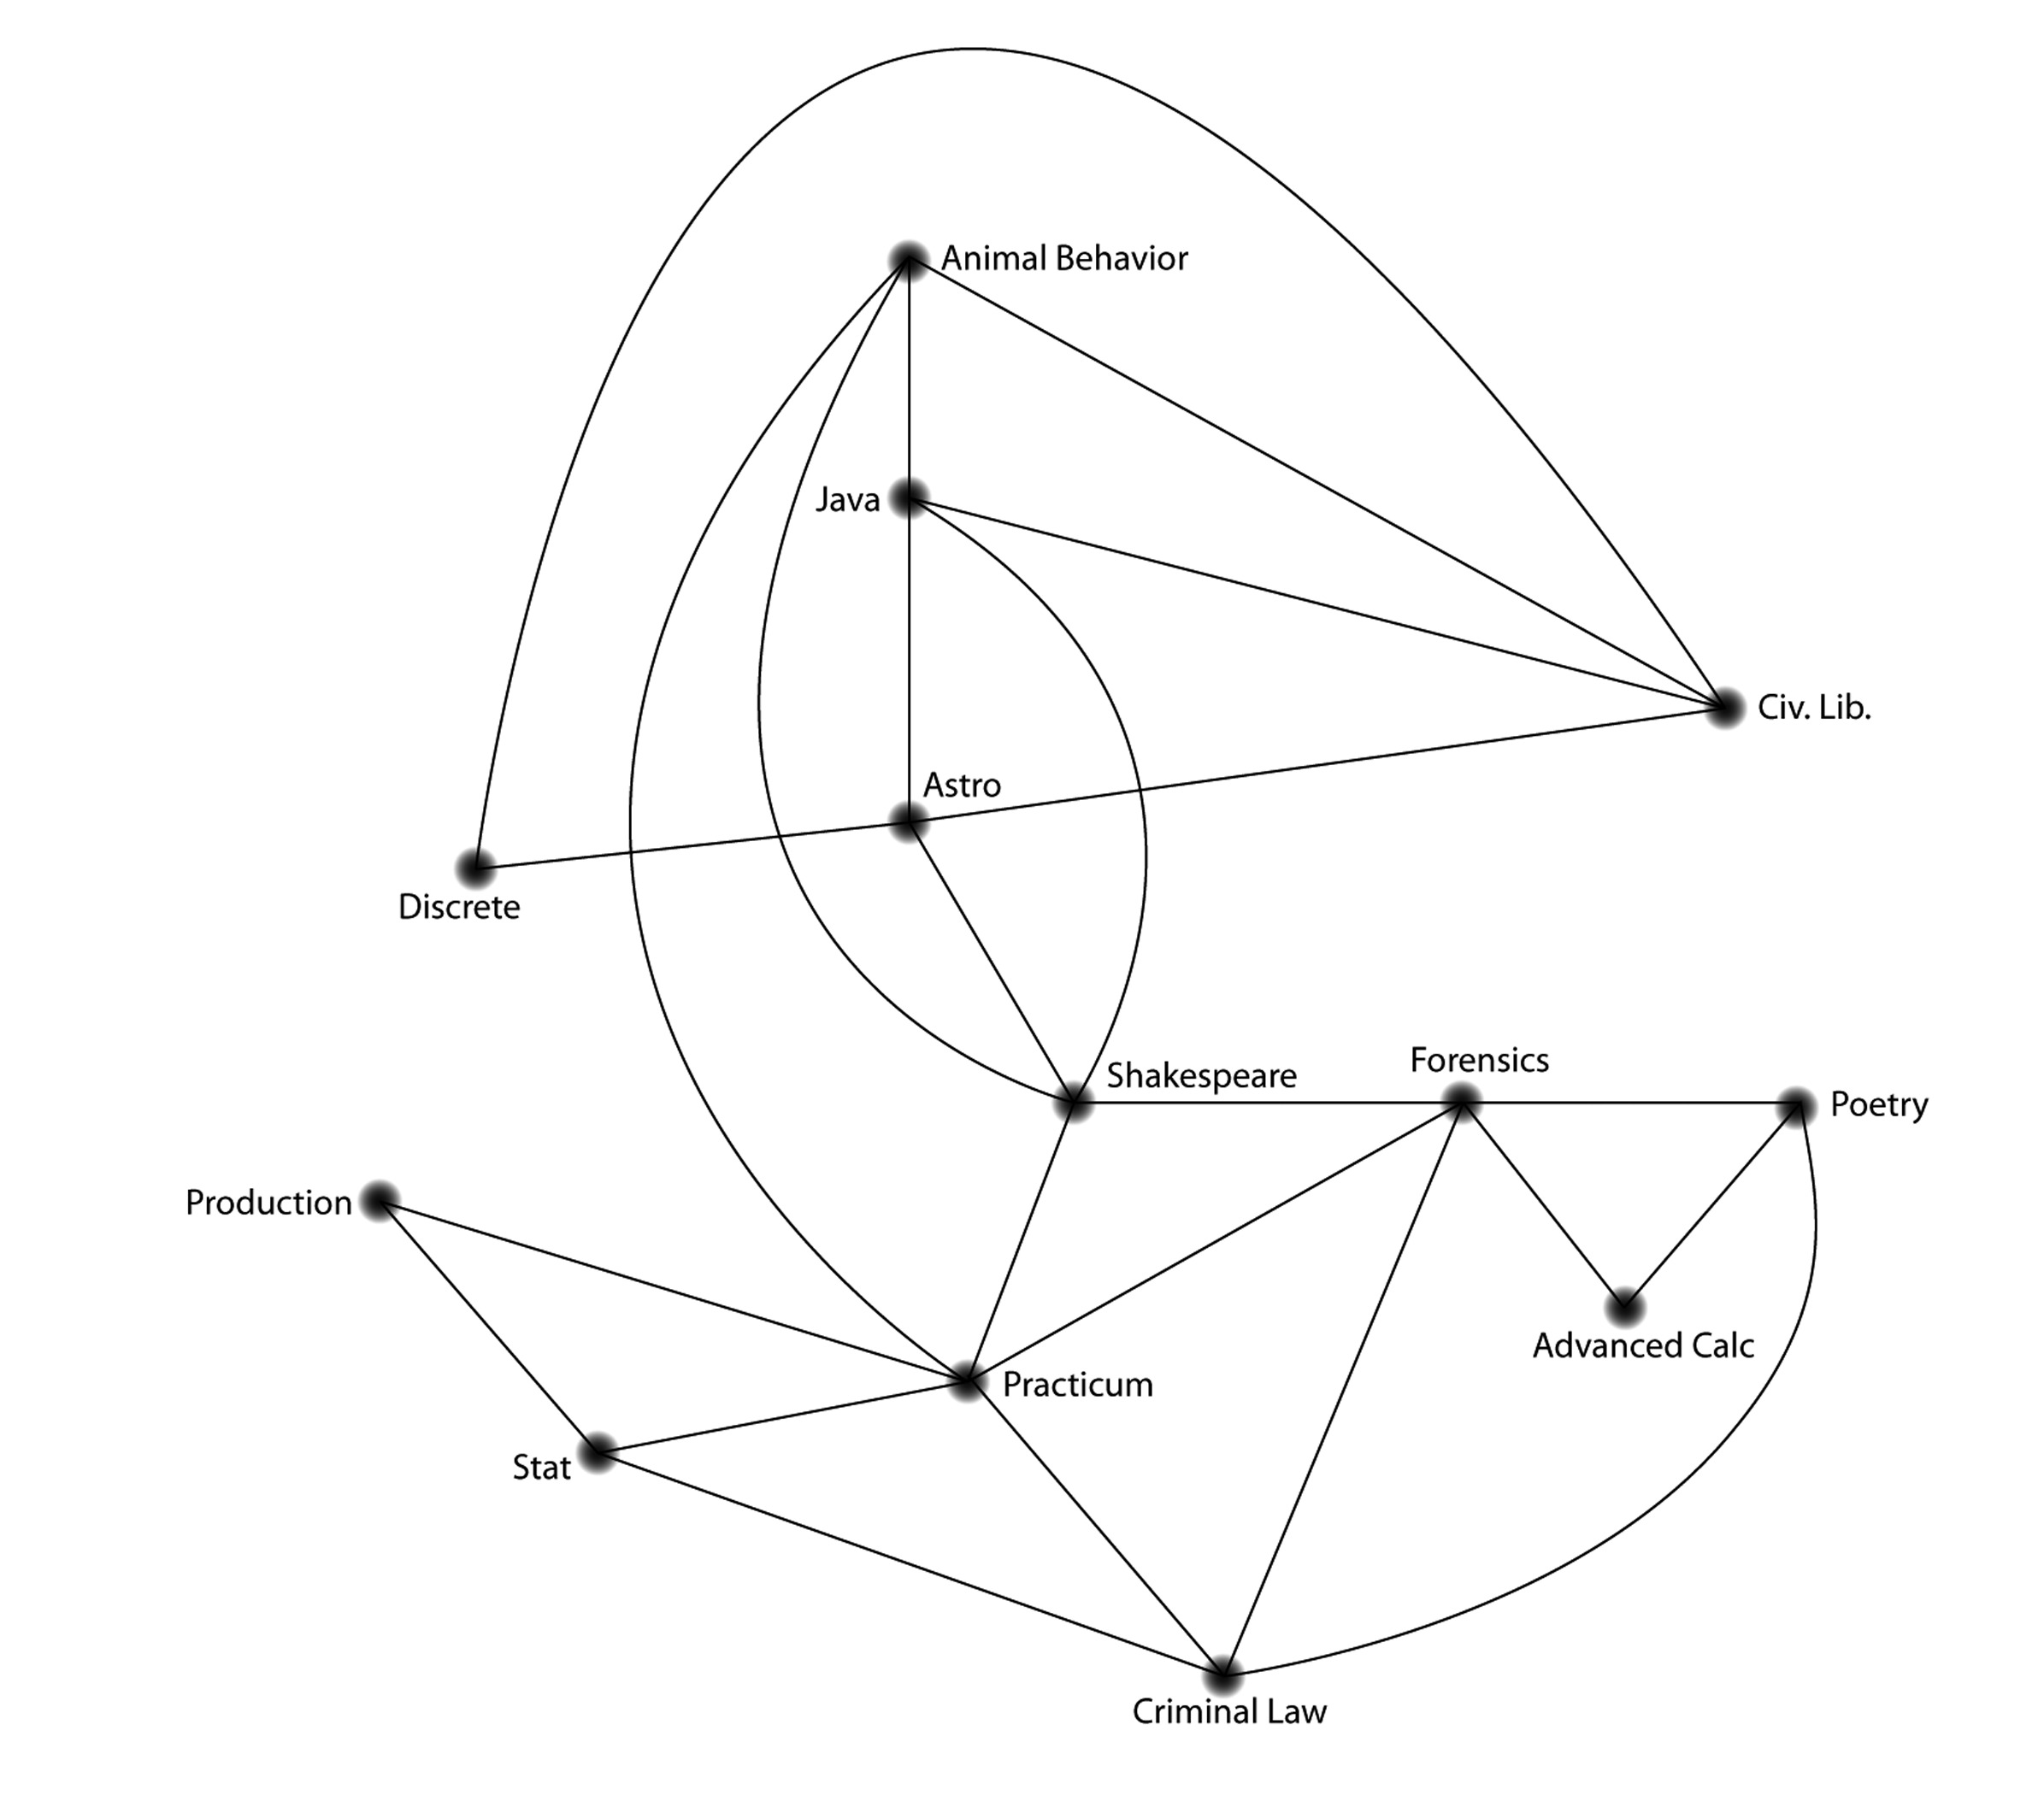
Check to see if this graph is still an accurate representation of the scheduling problem. Explain, in language a sixth-grader could understand, what you need to do to check if two graphs are isomorphic.
One final important concept that we will use is planarity. In the second version of the schedule graph, some edges crossed at places other than nodes. (For example, the edge connecting Animal Behavior to Shakespeare crosses the edge connecting Astro to Discrete.) In these cases, you can think of the edges passing under or over each other.
Graphs where you don’t have to do this — where there is a way you can draw them without crossing the edges — are called planar.
Why do you think the word “planar” might be used?
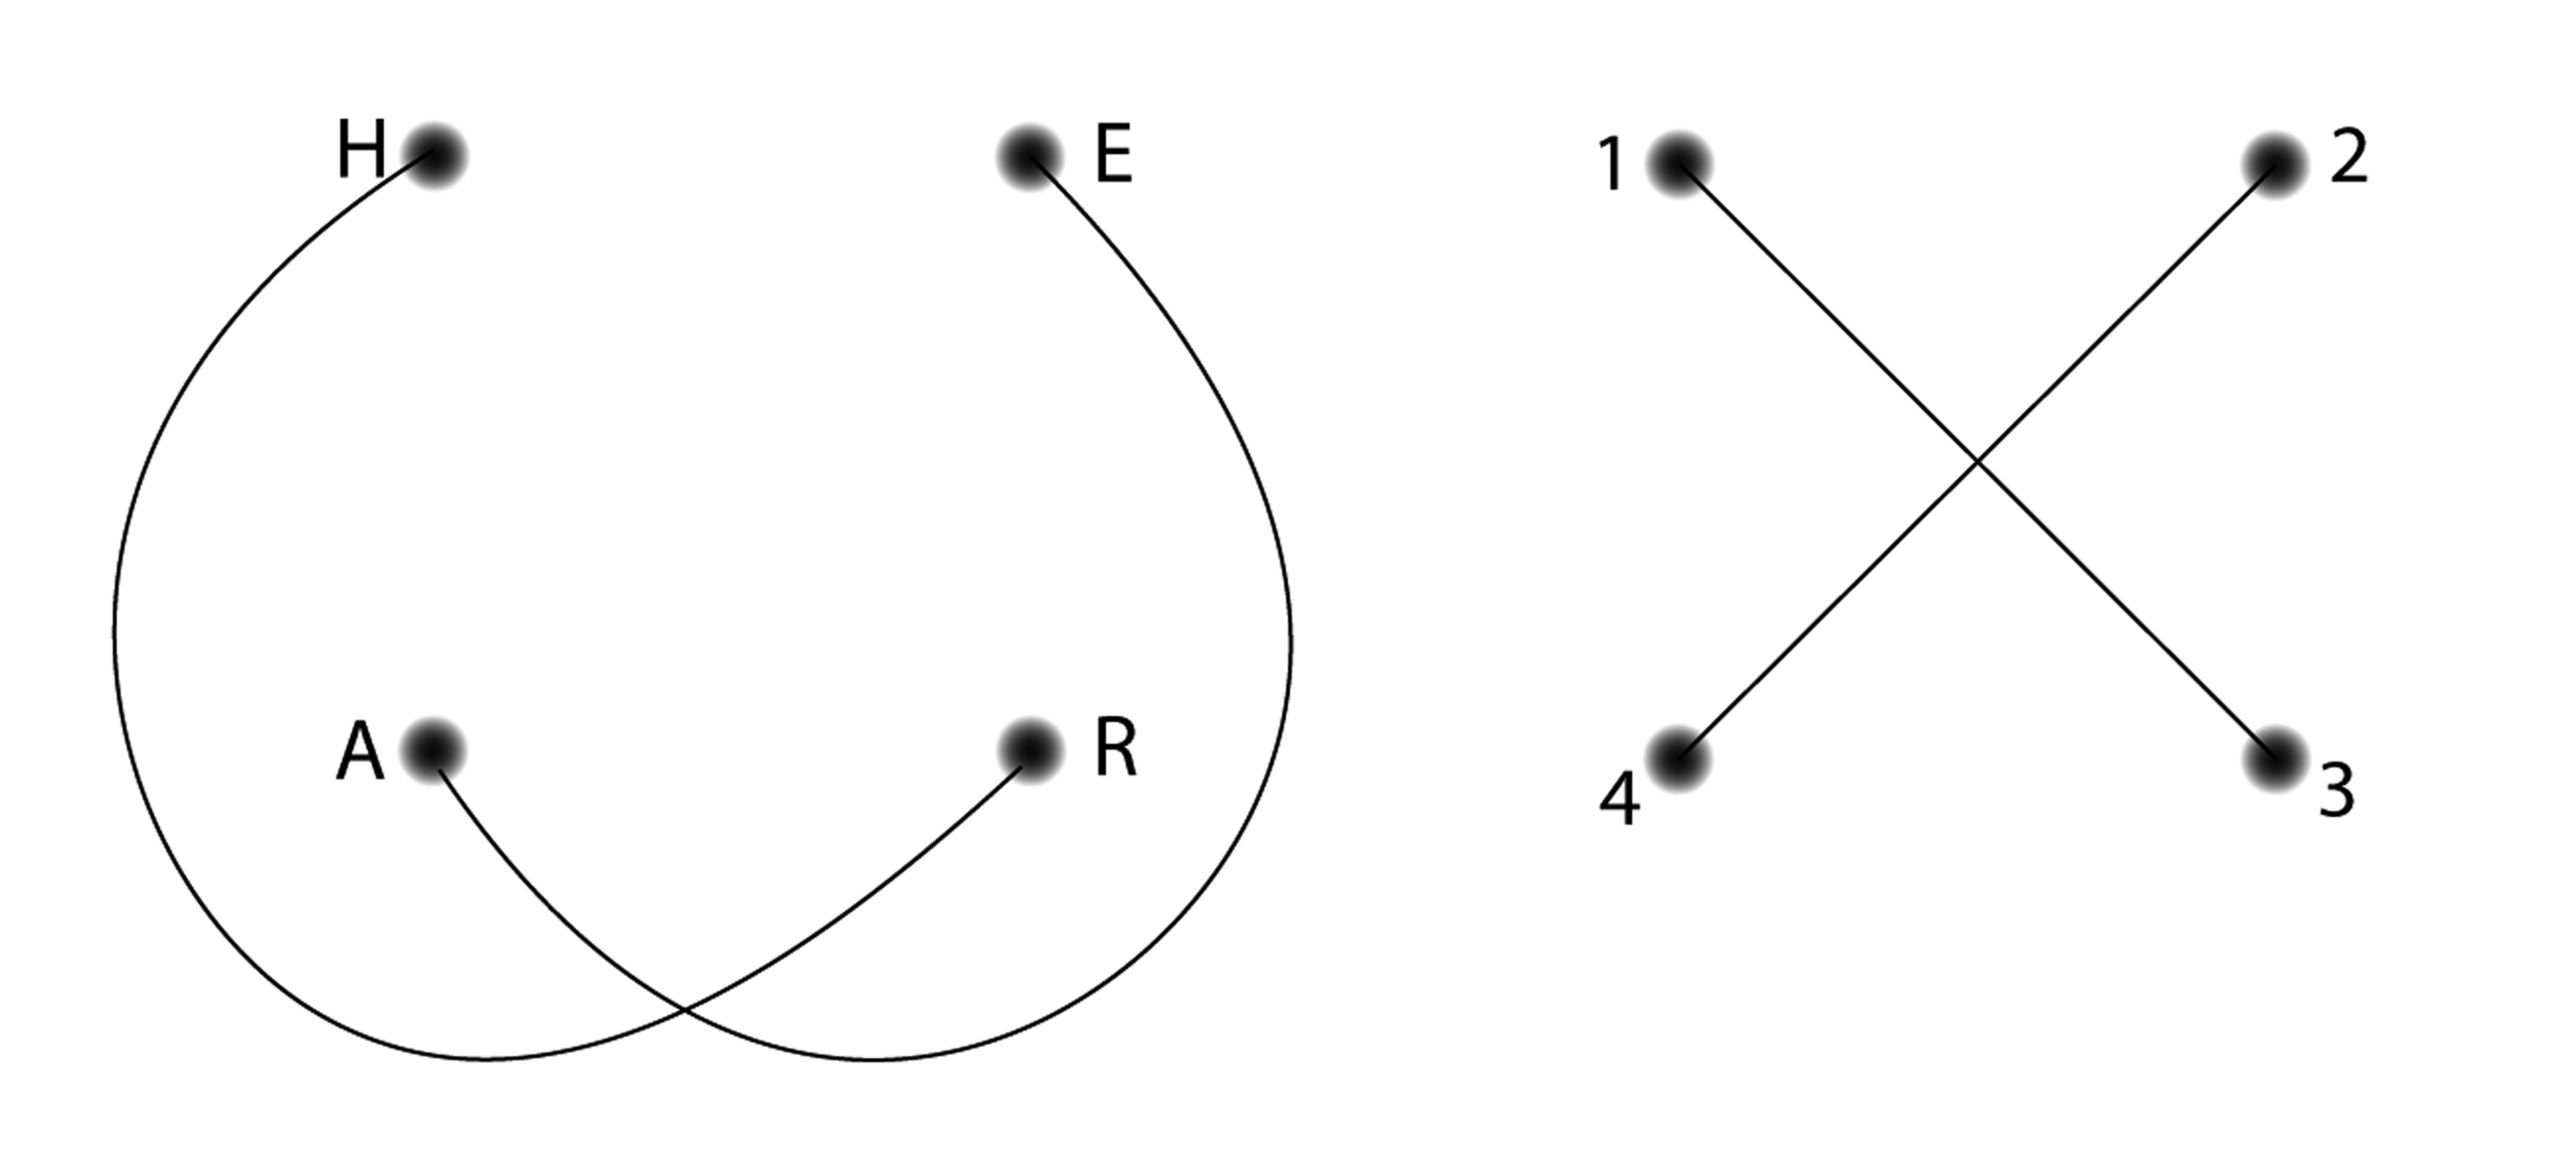
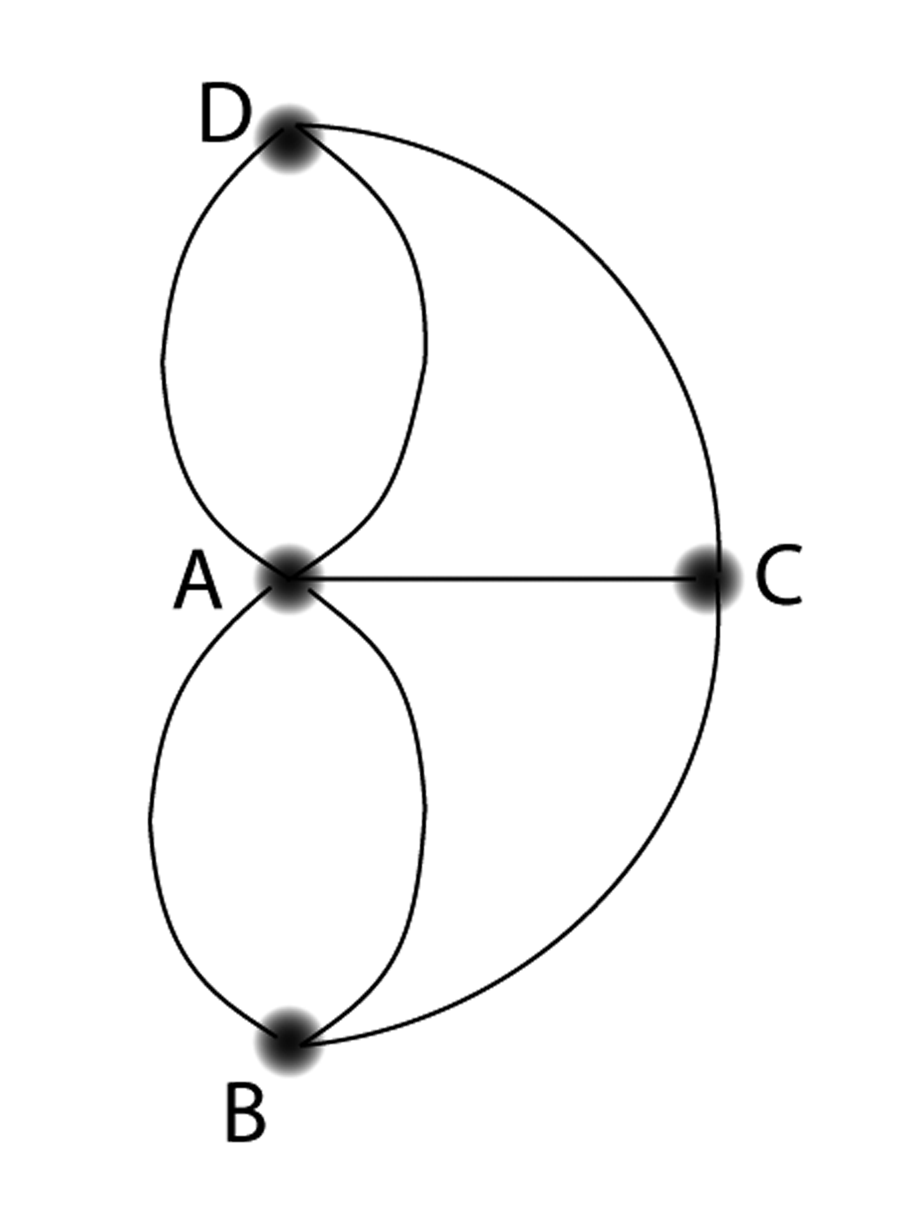
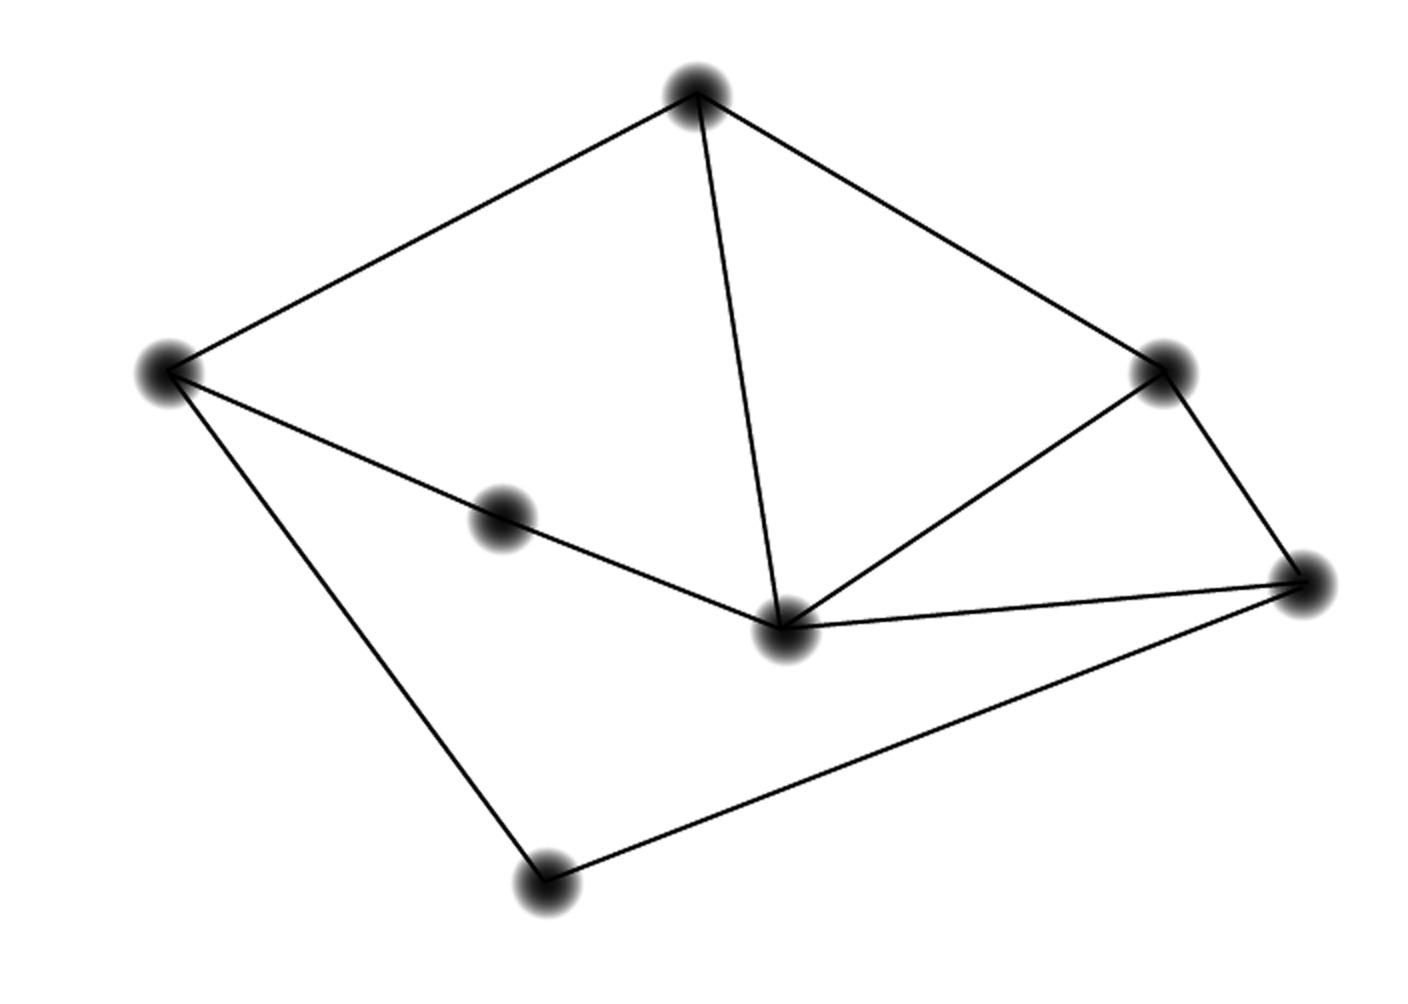
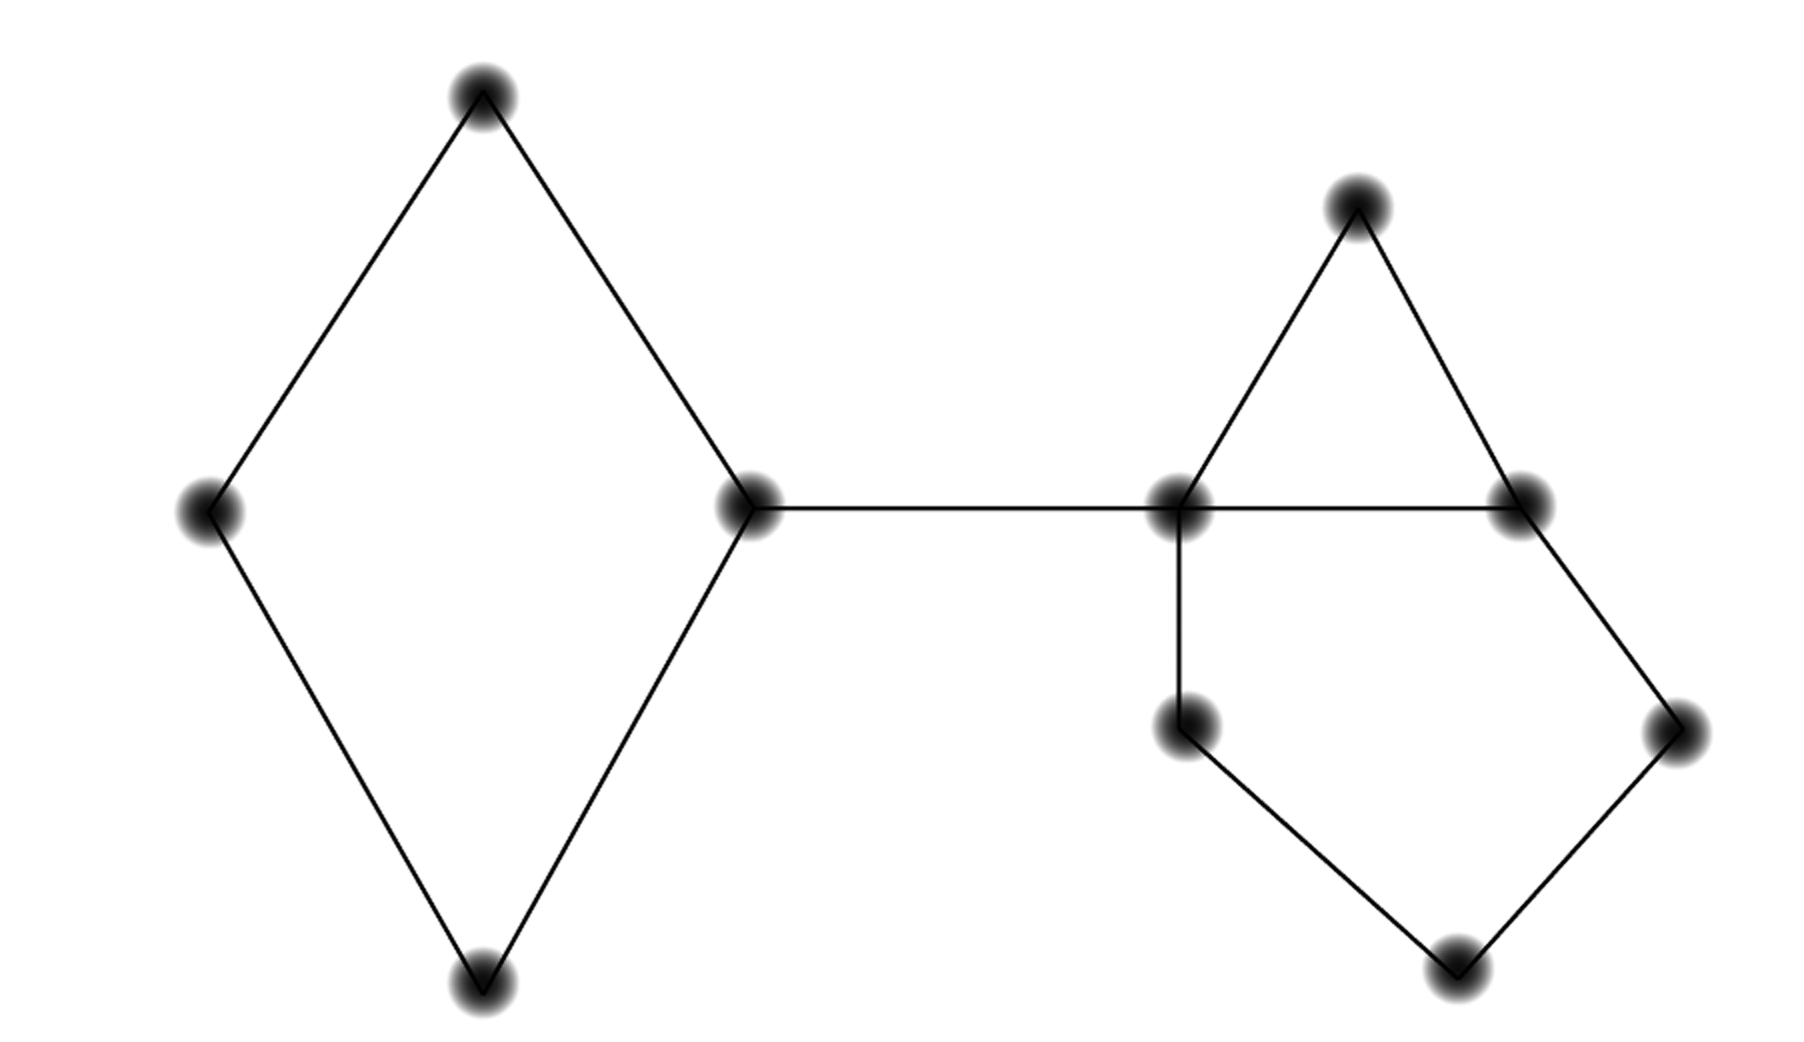
Note that a graph might be drawn with the edges crossing, and yet be isomorphic to a graph that is clearly planar, as in the following two graphs (with pairing 1-d, 2-a, 3-b, 4-c):
In this case, we still say the first graph is planar because it can be drawn with no edges crossing and still represent the same information. Imagine picking up nodes 1 and 2, with their edges still attached, and “uncrossing” them to get something with the same shape as the second graph.
Draw a nonplanar graph.
Find some degrees of nodes in the Middle East graph.
What is deg(Saudi Arabia)?
What is deg(Syria)?
What country’s node has the highest degree?
Practice
A shelter needs to find homes for nine cats. The table below indicates with an “x” which pairs of cats do not get along. Assuming that cats who do not get along cannot go with the same family, what is the minimum number of families needed to adopt all of these cats?
|
A |
B |
C |
D |
E |
F |
G |
H |
I |
|
|
A |
x |
||||||||
|
B |
x |
x |
x |
||||||
|
C |
x |
x |
x |
||||||
|
D |
x |
x |
x |
x |
|||||
|
E |
x |
x |
x |
x |
|||||
|
F |
x |
x |
x |
x |
|||||
|
G |
x |
x |
x |
x |
x |
||||
|
H |
x |
x |
x |
x |
x |
||||
|
I |
x |
x |
x |
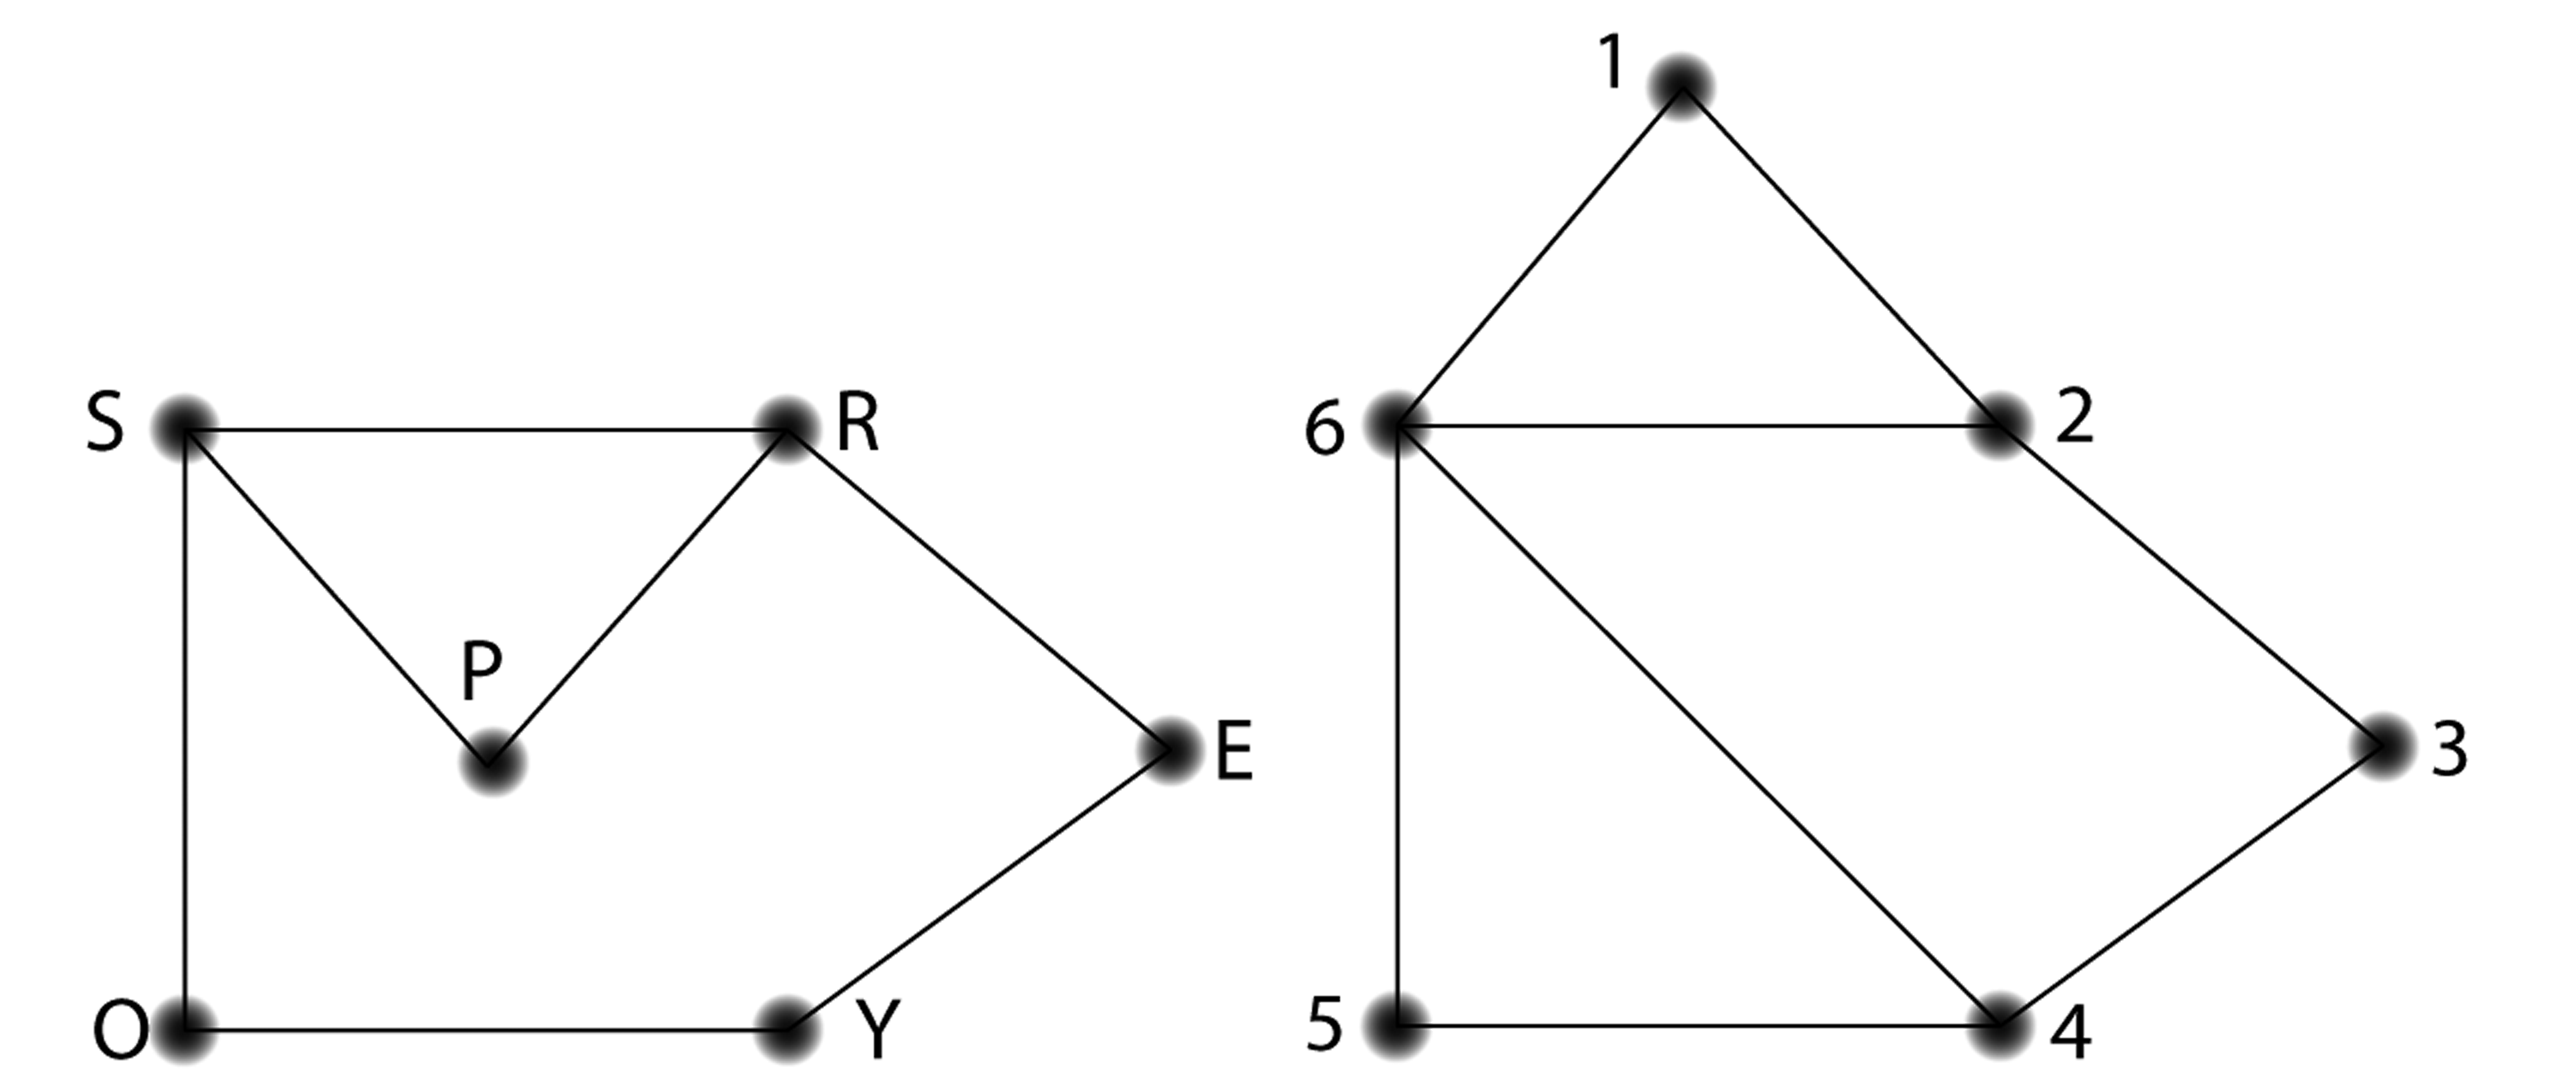
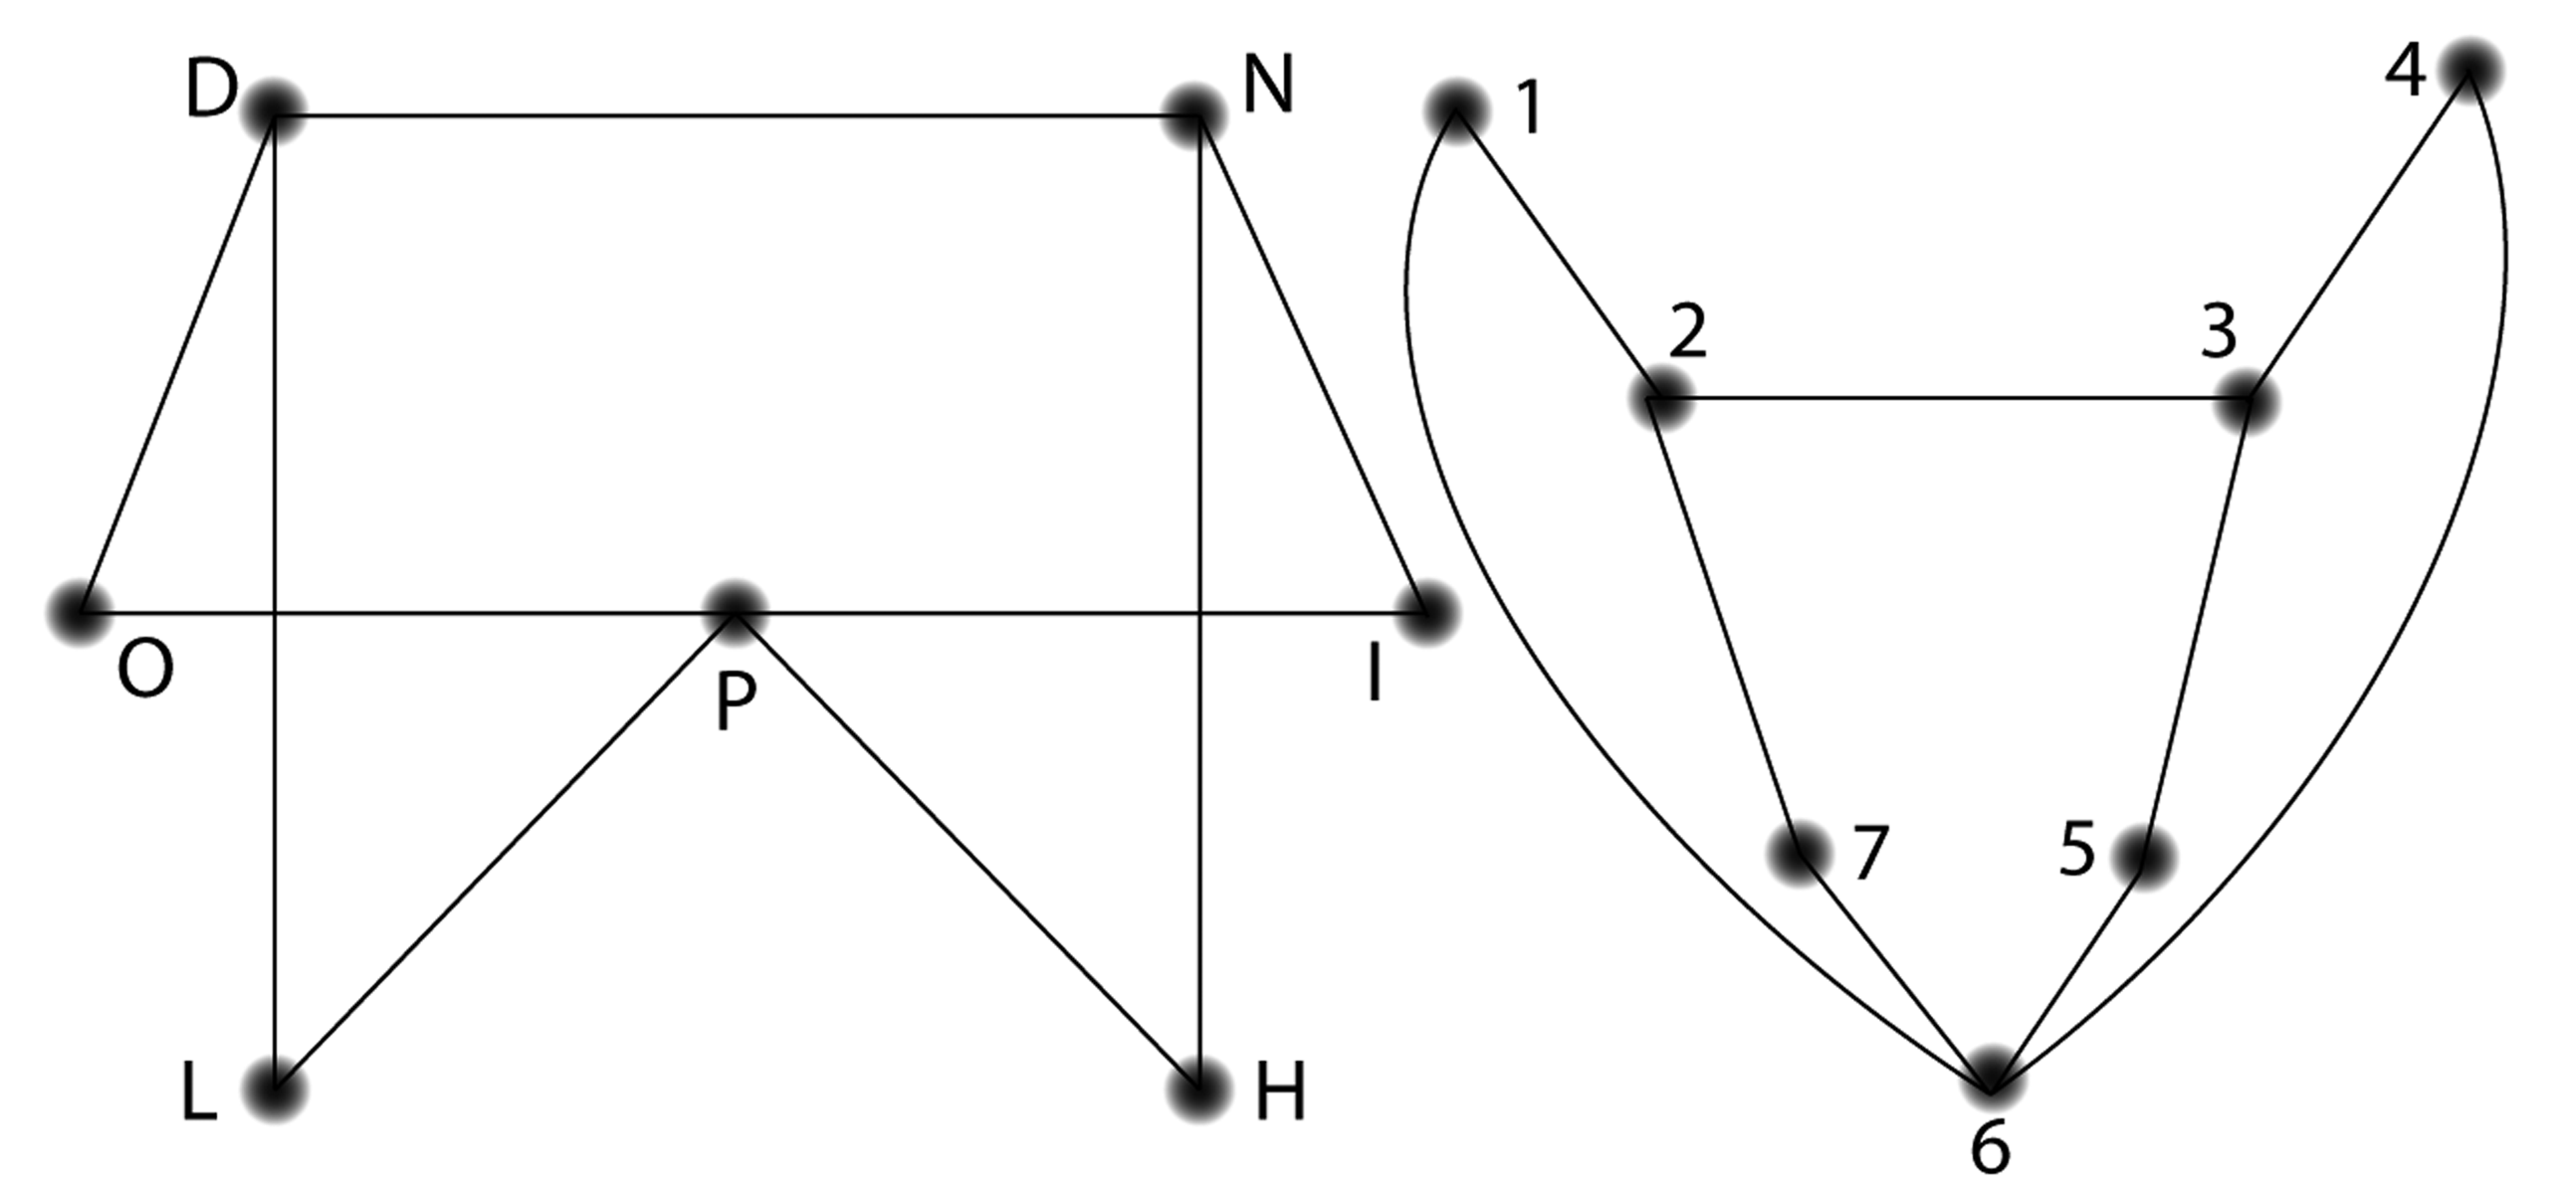
Which of these pairs of graphs are isomorphic? For graphs
that are isomorphic, give the pairing of the nodes.
Now is a good time to think about visualizing the edges
stretching and bending to see if you can make the shape on
the left look like the shape on the right.
Below is a map of the region surrounding Maryland.
(image from https://anthropology.si.edu/writteninbone/comic/activity/Background_Tidewater_Chesapeake.htm)
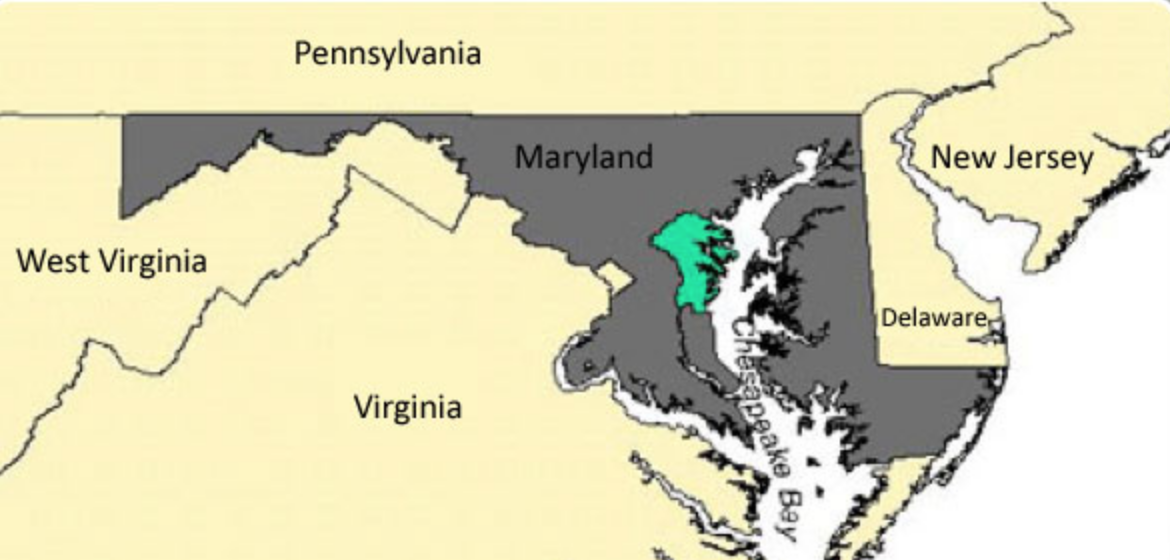
Which of the next three graphs is an accurate representation of the borders shared by the states on the map?

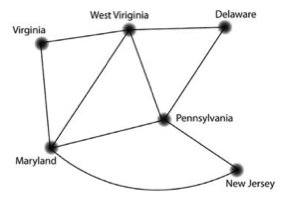

What’s the degree of each node in each of these graphs?
Which of these graphs are planar? For the ones that are planar, show how you can draw them with no edges crossing.
 b.
b. 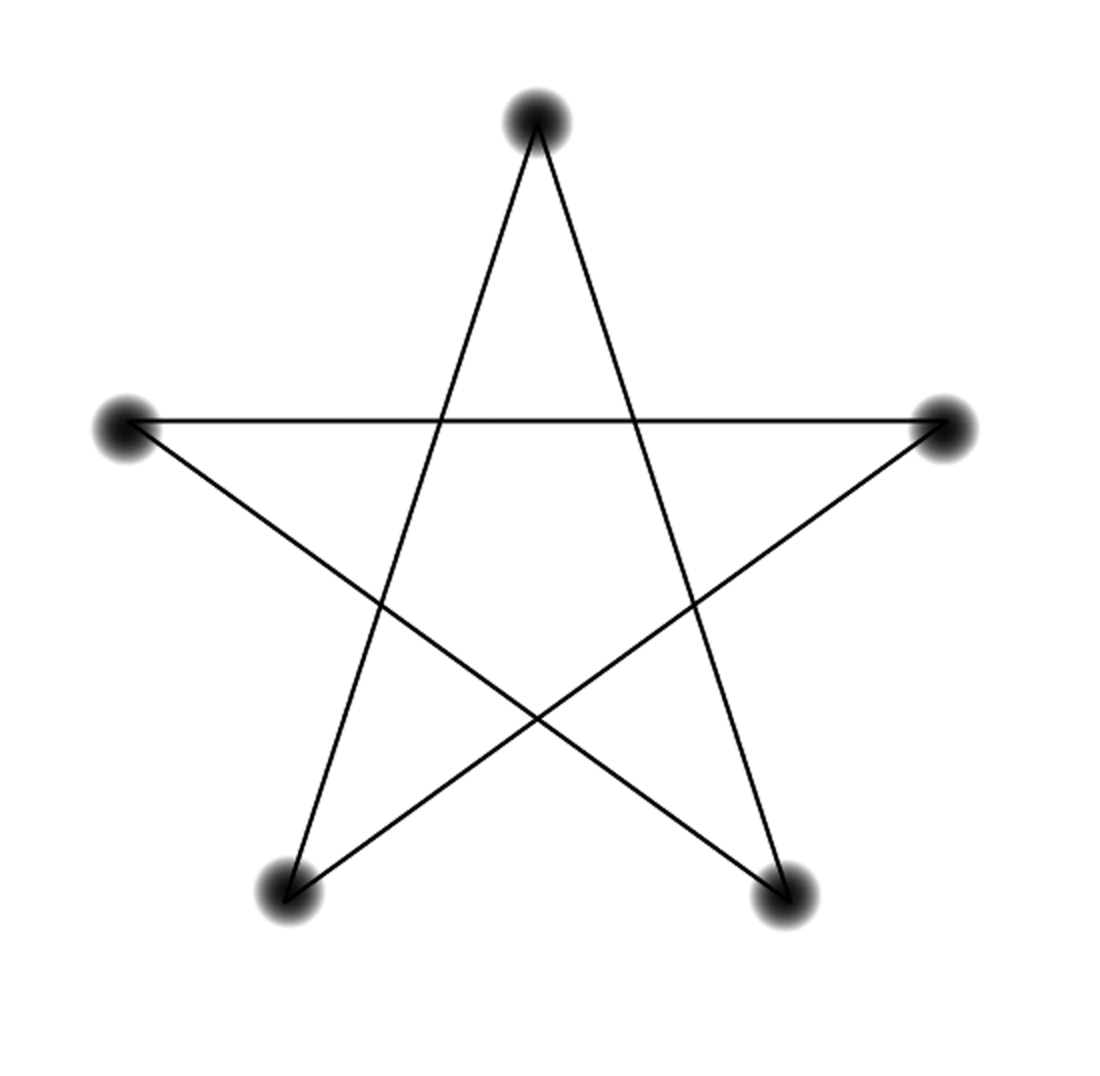
 d.
d. 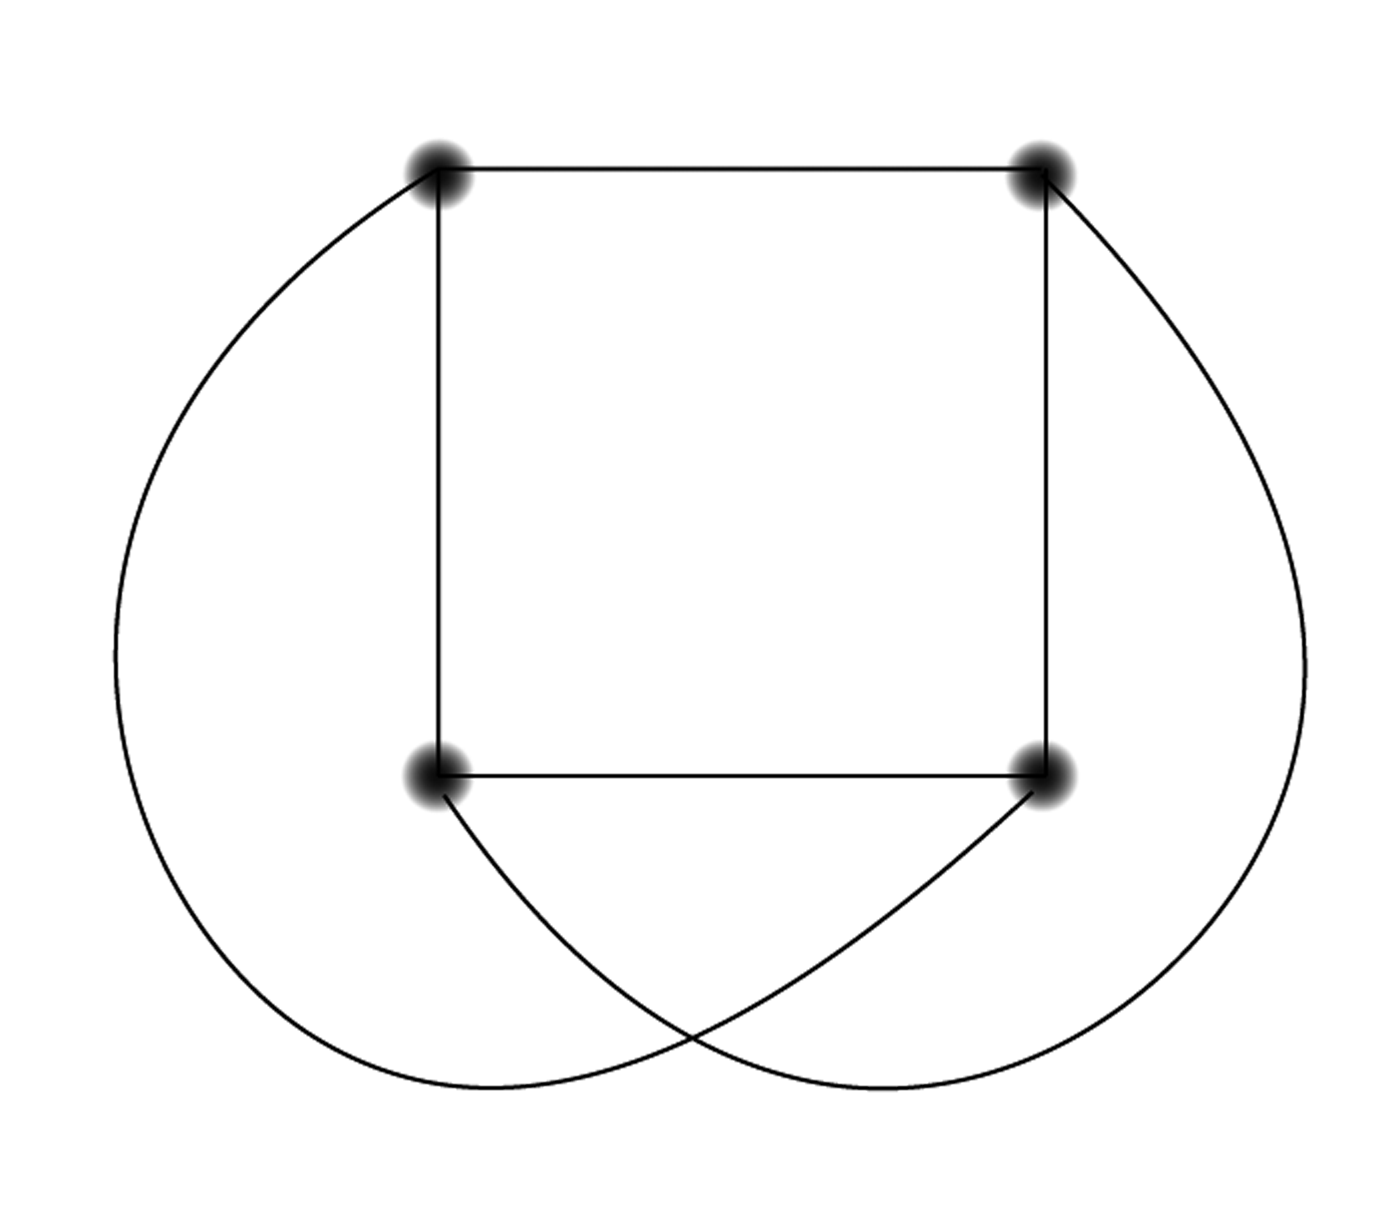
 f.
f. 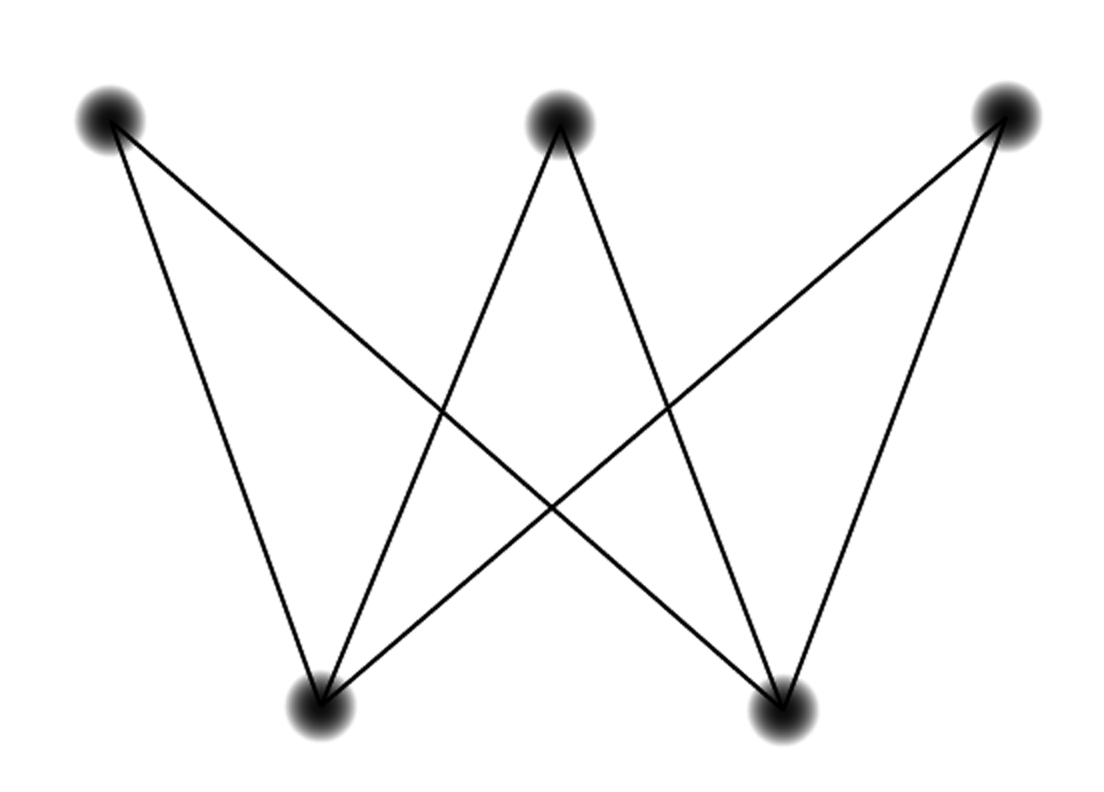
A school has four exam periods. If one student is enrolled in two different courses, the exams for those courses need to be scheduled in different periods so that the student may take both exams. The following chart shows the pairs of courses having at least one student enrolled in both.
|
Graphic |
Philos- |
Architecture |
Russian |
French |
Statistics |
Chemistry |
20th Century Lit |
|
|
Graphic Design |
x |
x |
x |
x |
||||
|
Philosophy |
x |
x |
x |
x |
||||
|
Architecture |
x |
x |
x |
|||||
|
Russian History |
x |
x |
x |
x |
x |
|||
|
French |
x |
x |
||||||
|
Statistics |
x |
x |
x |
x |
x |
|||
|
Chemistry |
x |
x |
x |
|||||
|
20th |
x |
x |
x |
x |
Represent this situation as a graph.
Is it possible to create an exam schedule so that no student has to be in two places at once?
Find an exam schedule that uses four different exam periods.
Problems
(From Finkbeiner and Lindstrom) The Board of Directors of XYZ Corporation has 16 members and 6 committees of 5 persons each as indicated by the following chart.
|
Committee |
Members |
|
1 |
A, D, G, K, N |
|
2 |
A, B, G, L, M |
|
3 |
H, J, L, P, R |
|
4 |
C, E, F, M, Q |
|
5 |
C, J, K, N, R |
|
6 |
D, E, H, P, Q |
How many distinct meeting times are needed to conduct the committee meetings of the board?
Draw a graph in which the total degree — that is, the sum of the degrees of each node — is odd.
The graph we used to represent bordering countries in problem 4 was planar. Create a map of your own countries for which the corresponding graph is nonplanar.
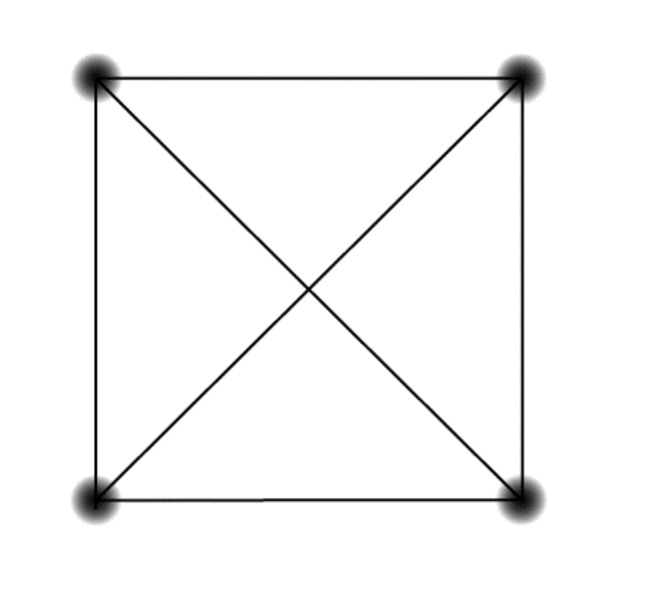
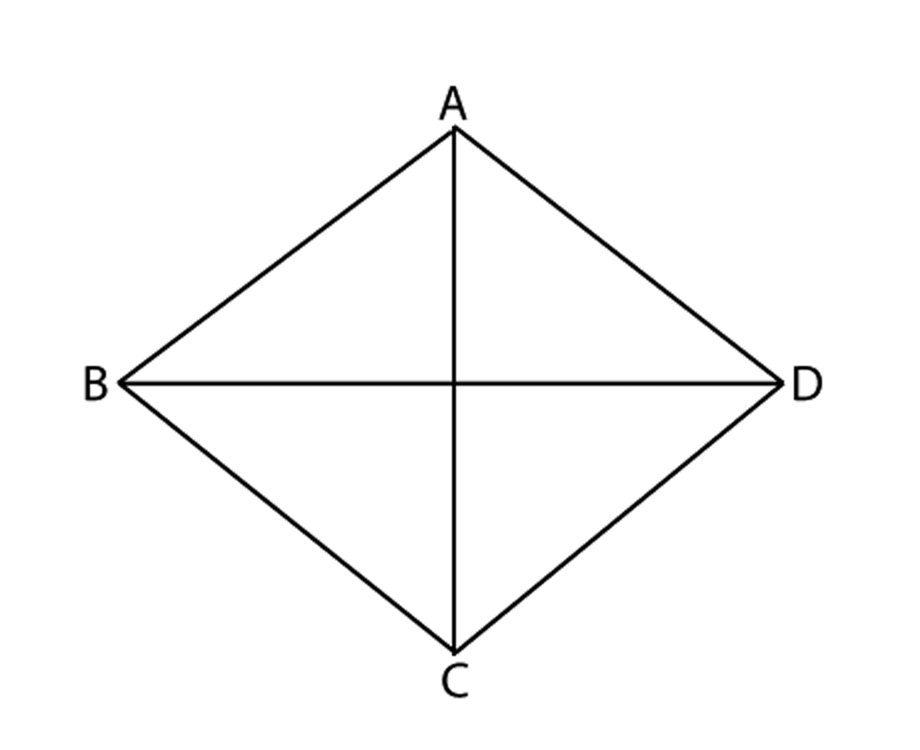
A graph is complete when every node is connected to every other node by an edge. Here’s a complete graph with four nodes:
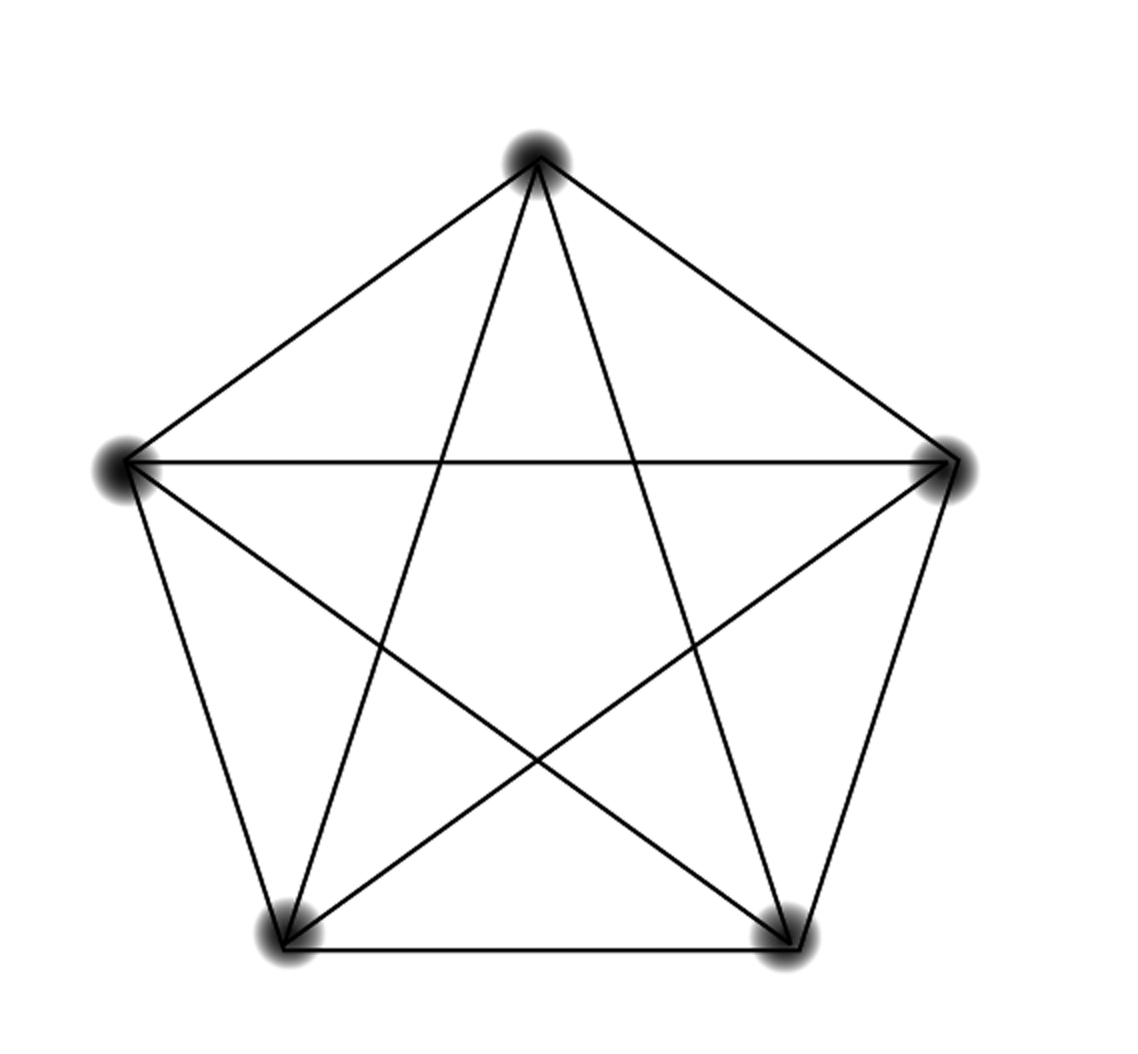
Draw:
A complete graph with five nodes.
A complete graph with six nodes.
A complete graph with three nodes.
How many edges will a complete graph with each of the following number of nodes have?
Five nodes
Six nodes
Three nodes
How would you calculate the number of edges of a complete graph with…
A hundred nodes?
n nodes?
Now that you know how the number of nodes and edges in a complete graph are related, investigate this relationship further.
Are the number of nodes and the number of edges in a complete graph related directly? That is, if you double the number of nodes, does the number of edges double, too?
Are the number of nodes and edges in a complete graph related linearly? Or does the number of edges go up “faster” or “slower” than in a linear relationship?
What’s the minimum number of nodes needed for a graph with 1000 edges, if at most one edge can connect two nodes, and no edge can connect a node to itself?
If a complete graph has 500 nodes, can you estimate the number of edges quickly? Is it more likely to be roughly 12500, 125000, or 1250000 edges?
In the complete graph with four nodes, pictured earlier, the graph is drawn so that some of the edges crossed. However, just because it is drawn that way in that particular diagram does not mean the graph is not planar.
Is the complete graph with four nodes planar?
Is the complete graph with five nodes planar?
How about complete graphs with more than five nodes?
The symbol “Deg,” as in the degree of a node, represents a function. What kinds of objects does Deg take as input? What kinds of objects does it output? By the way, the set of allowable inputs to a function is called its domain, and the set of allowable outputs is called its range.
For the next seven problems, it will be useful to change the representation of the problem using the tools of graph theory. The first question to ask yourself is always, “what should the nodes represent, and what should the edges represent?”
In this “Clue” game board, draw a graph in which you show which rooms can be reached from the others by the roll of a 6 on a die. Include the secret passages that you can take no matter what you roll from the Lounge to the Conservatory and from the Kitchen to the Study. If you roll a number higher than the number of spaces you need, you can still go in the room. By the way, is the Clue graph planar?

A group of six sophomores is going down to the Lower School to read to a group of six first-graders. The teachers asked for a list of preferences, both from the first-graders and the sophomores, as to who would read to whom.
| (First grader) | (would like to be read to by) |
|---|---|
| Algernon | Xenophon, Yvonne, Ulysses |
| Bartleby | Ulysses, Vlad, Yvonne, Zaphod |
| Curio | Vlad, Winnifred, Zaphod |
| Duncan | Winnifred, Zaphod, Xenophon |
| Evangeline | Ulysses, Xenophon |
| Francine | Ulysses ,Vlad, Winnifred, Zaphod |
| (Sophmore) | (would like to read to) |
|---|---|
| Ulysses | Algernon, Bartleby, Evangeline, Francine |
| Vlad | Bartleby, Curio, Francine |
| Winnifred | Bartleby, Curio, Duncan, Evangeline, Francine |
| Xenophon | Algernon, Evangeline |
| Yvonne | Algernon, Duncan, Francine |
| Zaphod | Bartleby, Curio, Francine |
Is there a way to form partners that will make everybody happy?
(From Epp) A traveler in Europe wants to visit each of six
cities shown on this map exactly once, starting and ending in
Brussels.
The distance (in kilometers) between each pair of cities is
given in the table. Suggest
a sequence of cities she can visit that
minimizes the distance traveled.
Berlin |
Brussels |
Dusseldorf |
Luxembourg |
Munich |
|
|---|---|---|---|---|---|
| Brussels | 783 | -- | |||
| Dusseldorf | 564 | 223 | -- | ||
| Luxembourg |
764 | 219 | 224 | -- | |
| Munich | 585 | 771 | 613 | 517 | -- |
| Paris | 1057 | 308 | 497 | 375 | 832 |
Wiki-Racing! The game of wiki-racing involves starting on
a randomly generated
Wikipedia page and taking Wikipedia links to navigate through
until you reach a designated ending page. For example, two
players on two different computers might agree to end on the
page for “Fruit Bat.” The first player to arrive at the Fruit
Bat Wikipedia page using only the links on Wikipedia pages
would win.
Below is a list of webpages in our miniature
version of wiki-racing. Each webpage links to some, but not
necessarily all, of the others.
|
Wikipedia Page |
Links on that page |
|
Toy Story |
Walt Disney Pictures Pixar Animation Studios |
|
Toy Story 3 |
Buzz Lightyear Toy Story |
|
Pixar Animation Studios |
Meet the Robinsons |
|
Buzz Lightyear |
Pixar Animation Studios Walt Disney Pictures Toy Story |
|
Meet the Robinsons |
Walt Disney Pictures Toy Story 3 |
|
Walt Disney Pictures |
Pixar Animation Studios |
How could you represent this situation using a graph?
What is the fewest number of clicks it will take to go from the Toy Story page to the Toy Story 3 page? From the Toy Story page to the Buzz Lightyear page?
Oh, no — your parents just announced that they’re dropping by your apartment for a surprise visit. But your place is a mess. Fortunately, you’ve got some elves — as many as you need — to help you clean the place, but even an elf can’t wash lights with darks. Here’s what you and the elves have got to do, and the time it takes to do each thing:
-
Wash your load of light-colored laundry
(30 mins) -
Wash your load of dark-colored laundry
(30 mins, and remember you’ve only got one washer) - Dry your lights (45 mins, and you have to wash the lights first)
- Dry your darks (45 mins, you have to wash the darks first, and you’ve only got one dryer)
- Scrape off the dishes in your sink (10 mins)
-
Load and run the dishwasher
(60 mins, and you have to scrape first) -
Pick your stuff up off of the floor
(20 minutes) - Vacuum (10 minutes, and you have to pick up your stuff first)
Find a good graph-theory way to represent this problem. How long will it take you to put your apartment in order?
What is the minimum number of elves you need to do everything in that amount of time?
You have a ${3 \times 3 }$ chessboard. The black knights are in the top two corners, and the white knights are in the bottom two corners. No other pieces are on the board. (Recall that the only moves knights are allowed to make is “2 up or down, 1 left or right,” or “1 up or down, 2 left or right,” but that they can “jump” pieces.)
How many moves will it take to switch the position of the knights, so that the black knights are now in the bottom two corners and the white knights are in the top two corners?
How many moves will it take just to switch the two rightmost knights?
Below is a map of the town of Königsberg, Prussia, as it existed in the 18th Century. A popular puzzle at the time was to cross all seven bridges without ever going back over a bridge you’ve crossed, and wind up at your starting point. Solve the puzzle yourself. (The mathematician Leonhard Euler invented graph theory by analyzing this problem.)
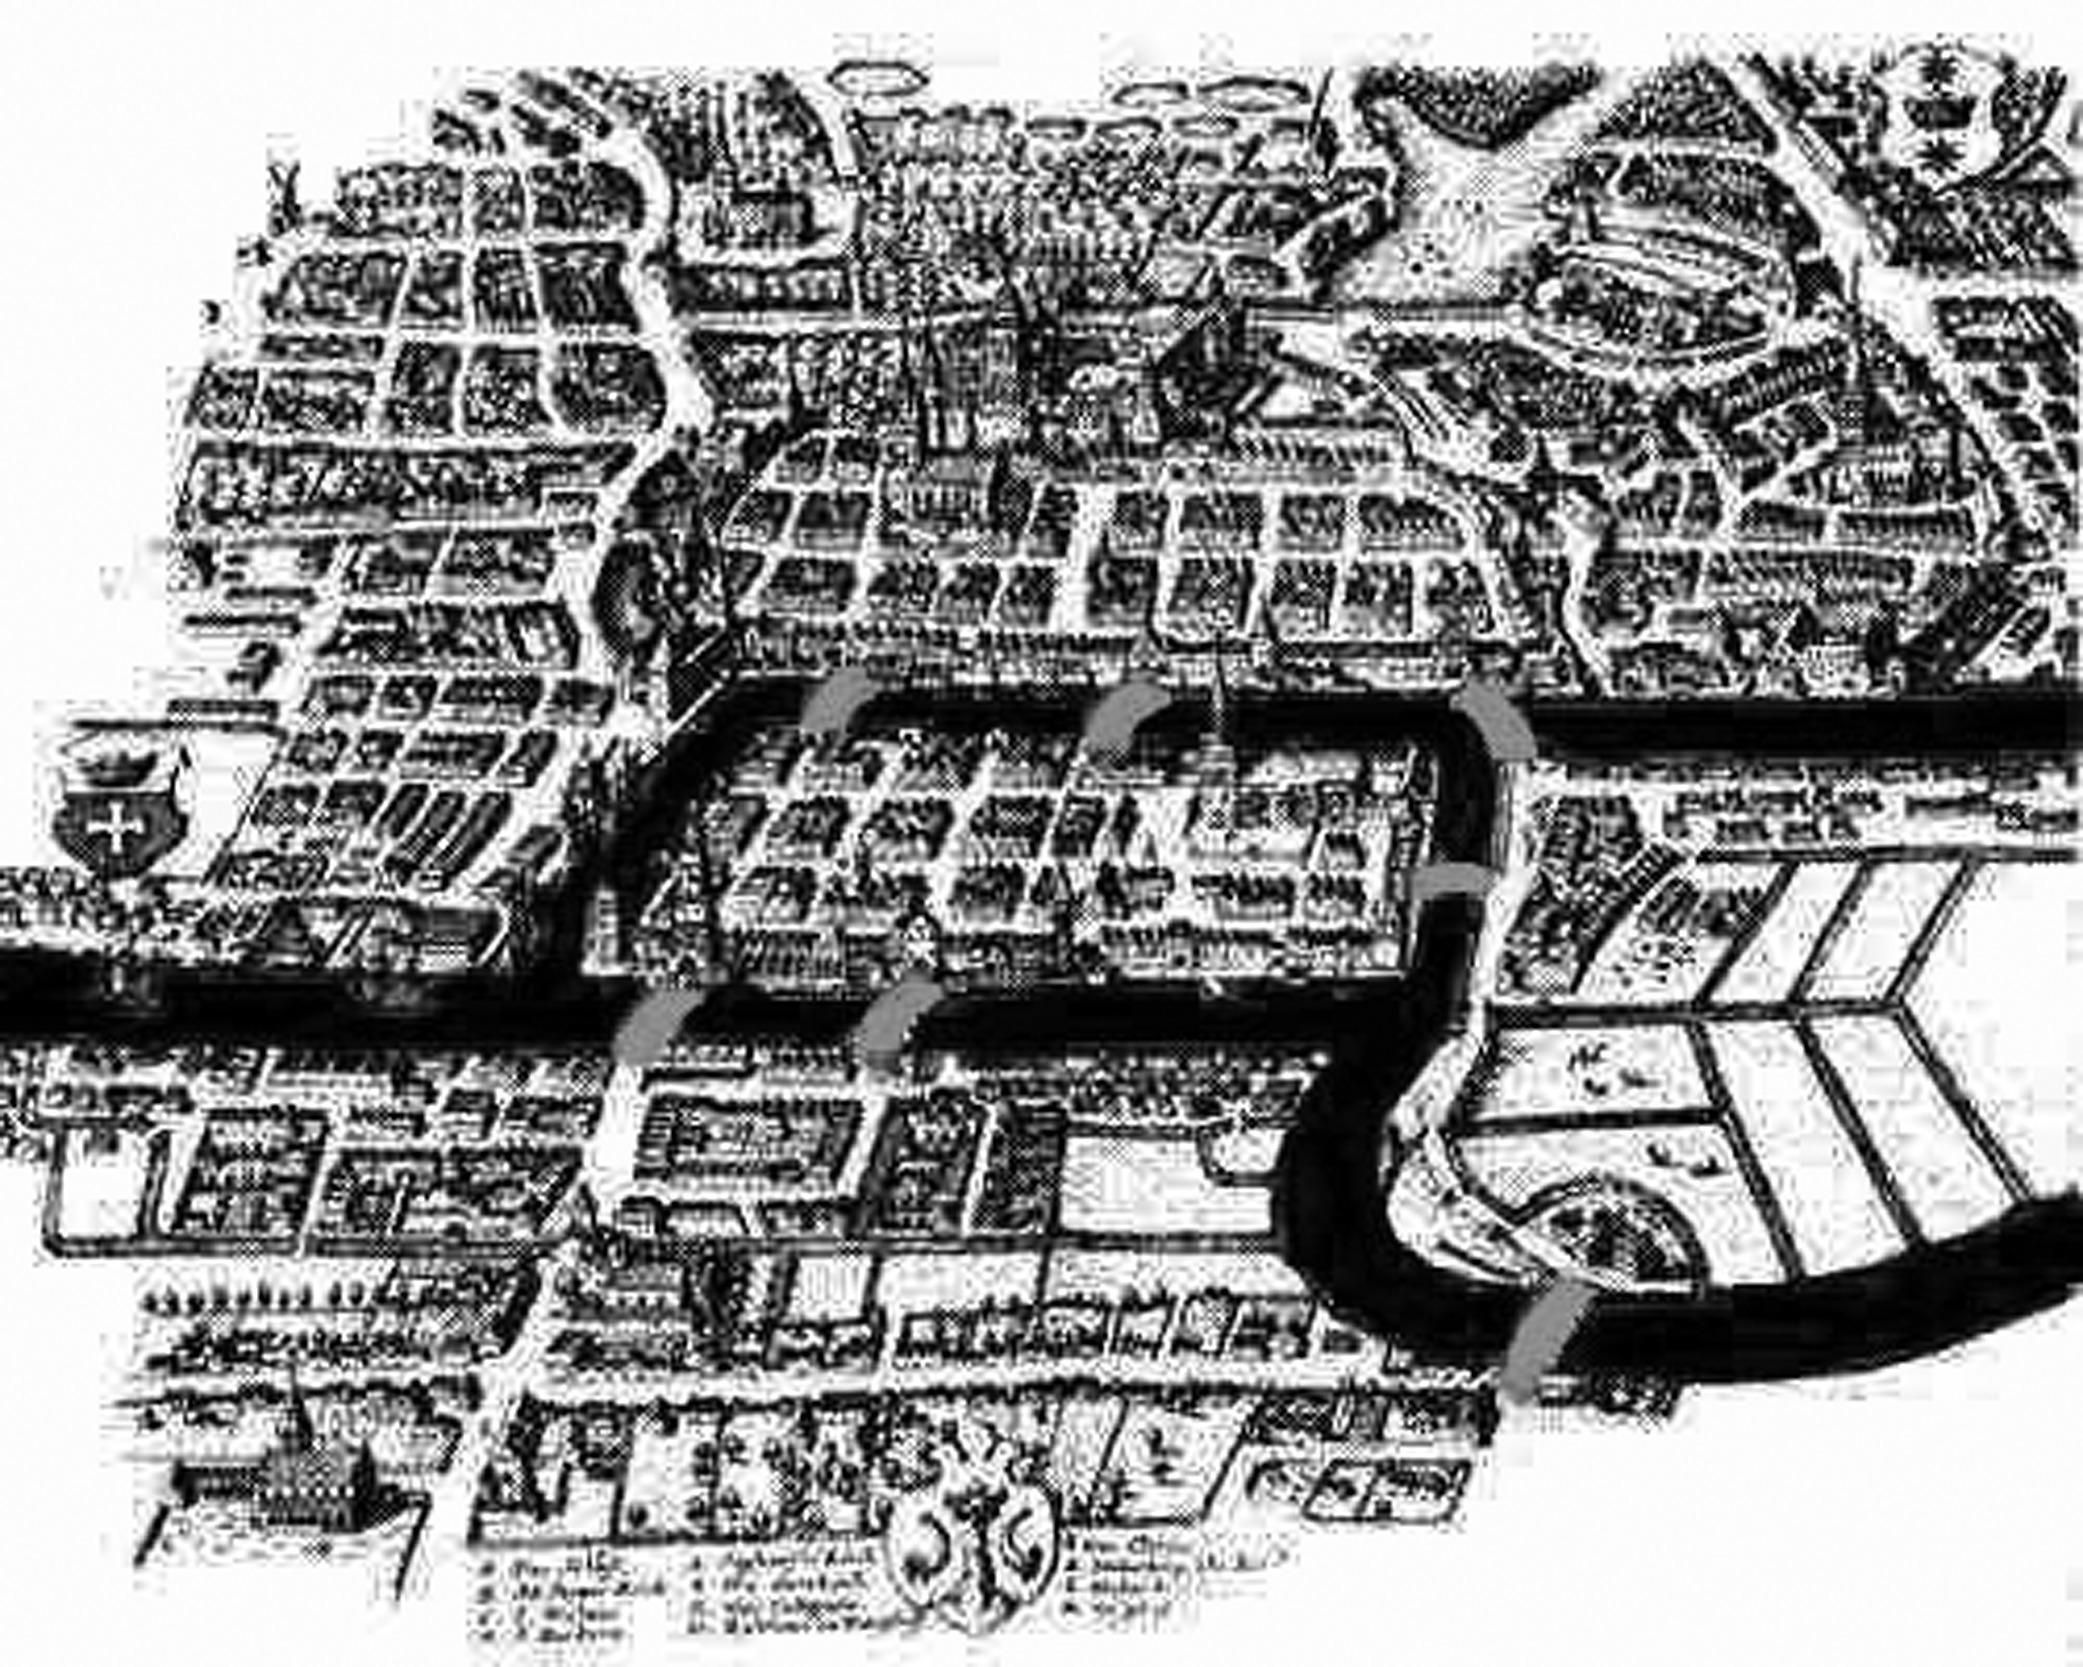
Image from solipsys.com.uk/new/KoenigsbergImages.html
For each figure, say whether you can trace it with your pencil without going over any segment twice, ending at your starting point.

A graph that can be traced in the manner of the previous problem is said to have an Euler Circuit, named after the mathematician who invented graph theory. Propose a method for determining if a given graph has an Euler circuit or not. (Are any of the concepts you’ve learned in this lesson relevant?) Make up new examples to test, if necessary.
Which complete graphs have Euler circuits?
The Irish mathematician William Rowan Hamilton invented a
game in the 1850s called the Icosian Game. In it, you had to
visit a list of cities connected by roads, as represented by
the graph below.
(image from
mathworld.wolfram.com/
IcosianGame.html)
The challenge was to start in one city and follow the roads to visit all the cities, winding up at your starting city without ever having visited a city twice. Solve the Icosian Game.
If you read the previous problem carefully, you won’t be surprised to learn that a circuit of the type you found — one where you need to visit each node exactly once and return to your starting node — is called a Hamiltonian circuit. Find Hamiltonian circuits for each graph below.
Do you suppose that all graphs have
Hamiltonian circuits?
Don’t use a calculator for this problem.
Factor ${x^2} + 8x + 16$
Factor ${x^2} - 16$
Solve for $x$: ${x^2} - 5x + 6 = 0$
Subtract $4 \frac{7}{5} - 2 \frac{1}{3}$
If $x^2+y^2=30$ and ${(x + y)^2} = 484$ , what is $xy$ ?
The diagram below shows a blueprint of three different utility companies and three houses. You want to add to the blueprint lines running from each utility company to each house, but the lines cannot cross one another. Suggest a way to do this or argue that it is impossible.

You may not have needed a graph to fully analyze the previous problem — but clearly, you could have drawn a graph to represent the situation. Graphs like the one in problem 43 that have two different groupings of nodes are called bipartite. In a bipartite graph, edges may only be drawn between nodes in two different groups (like house and utility); they never connect nodes in the same group. When you solved Problem 30, you also would have used a bipartite graph; however that graph was not a complete bipartite graph, whereas the graph in 43 is complete bipartite. Do you see why?
Draw a complete bipartite graph between two groups of two nodes. This graph is abbreviated $K_{2,2}$. Now draw $K_{2,4}$. Using this notation, what graph were you working with in Problem 43?
How many colors are needed to color the graph $K_{2,4}$? How about $K_{m,n}$?
Find a formula for the total degree
of $K_{m,n}$.
In the three-utilities puzzle (see problem 43), suppose now that lines are allowed to cross, and so the lines are actually run that way. If you accidentally cut one of the pipes without knowing which one it is, what’s the probability that the gas in the leftmost house will go out? How about if there are $m$ houses and $n$ utilities, instead?
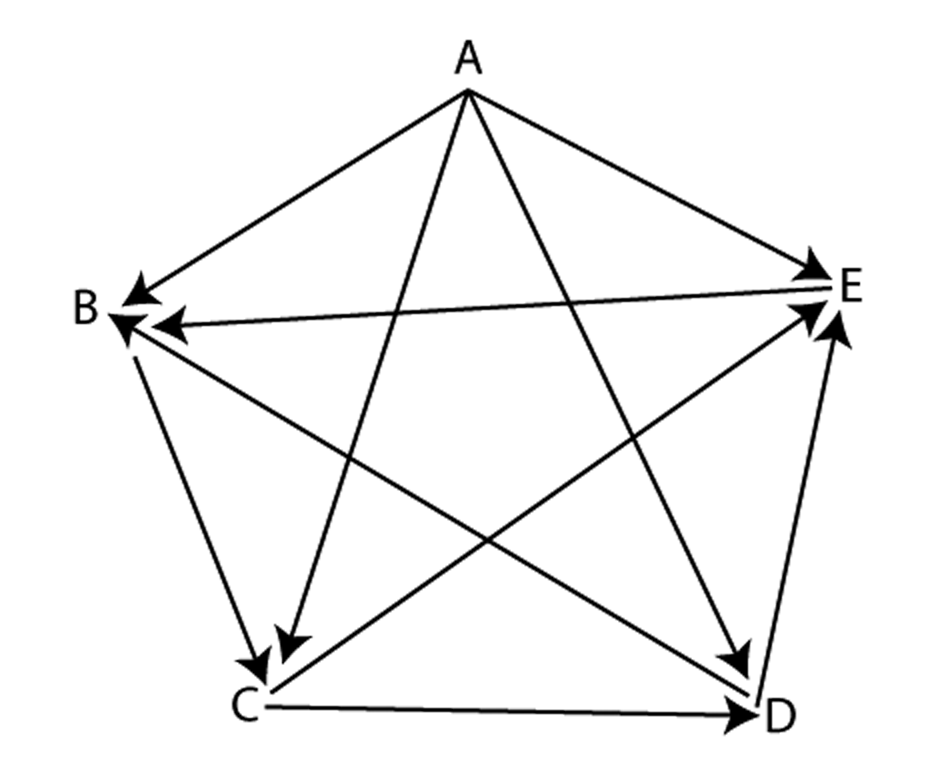
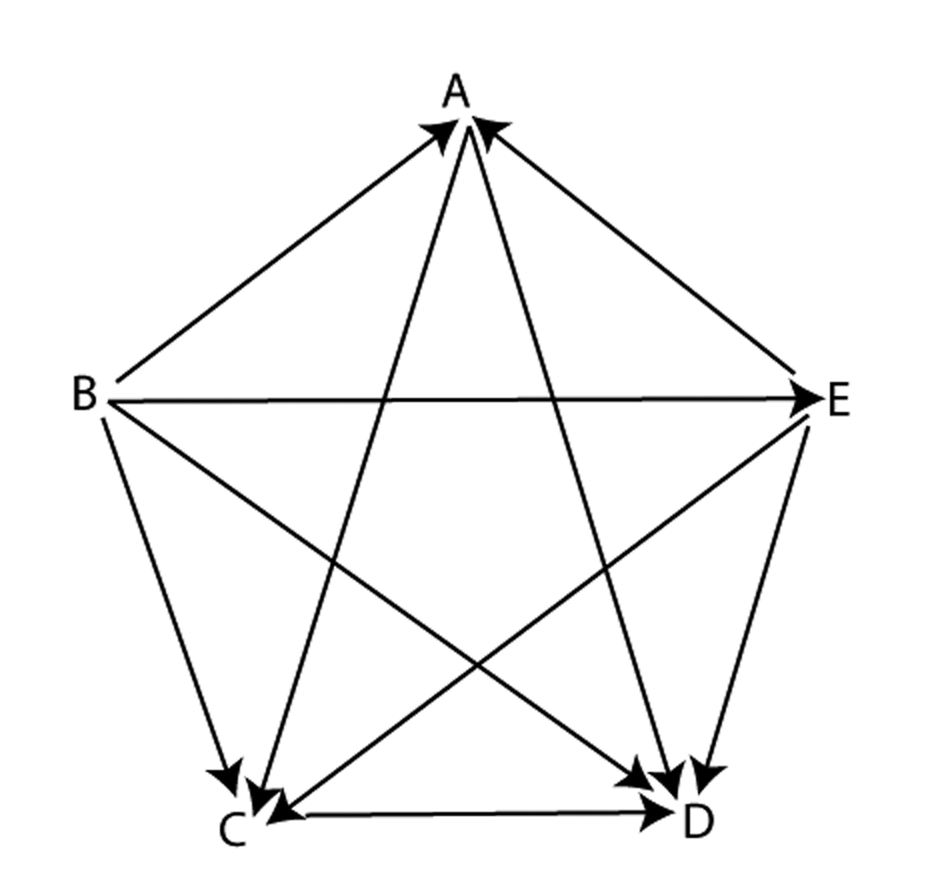
Any graph that could represent “who beat whom” in a situation where each team plays every other team once is called a tournament. Which of the graphs below are tournaments?
The Game of Sprouts: Mark a few dots on a piece of paper. A move consists of two actions: connect two different dots with a single edge then place a dot at around the middle of this edge. You can only connect two dots if each has a degree of less than 3, and you may not repeat an edge or cross edges. The person who has no move is the loser.
If you start with only two dots, then what is the maximum number of moves the game can last?
At the end of the two-dot sprouts game, what will be the total degree of the diagram?
At the end of the $n$-dot sprouts game, what will be the total degree of the diagram?
How many moves will the $n$-dot sprouts game take?
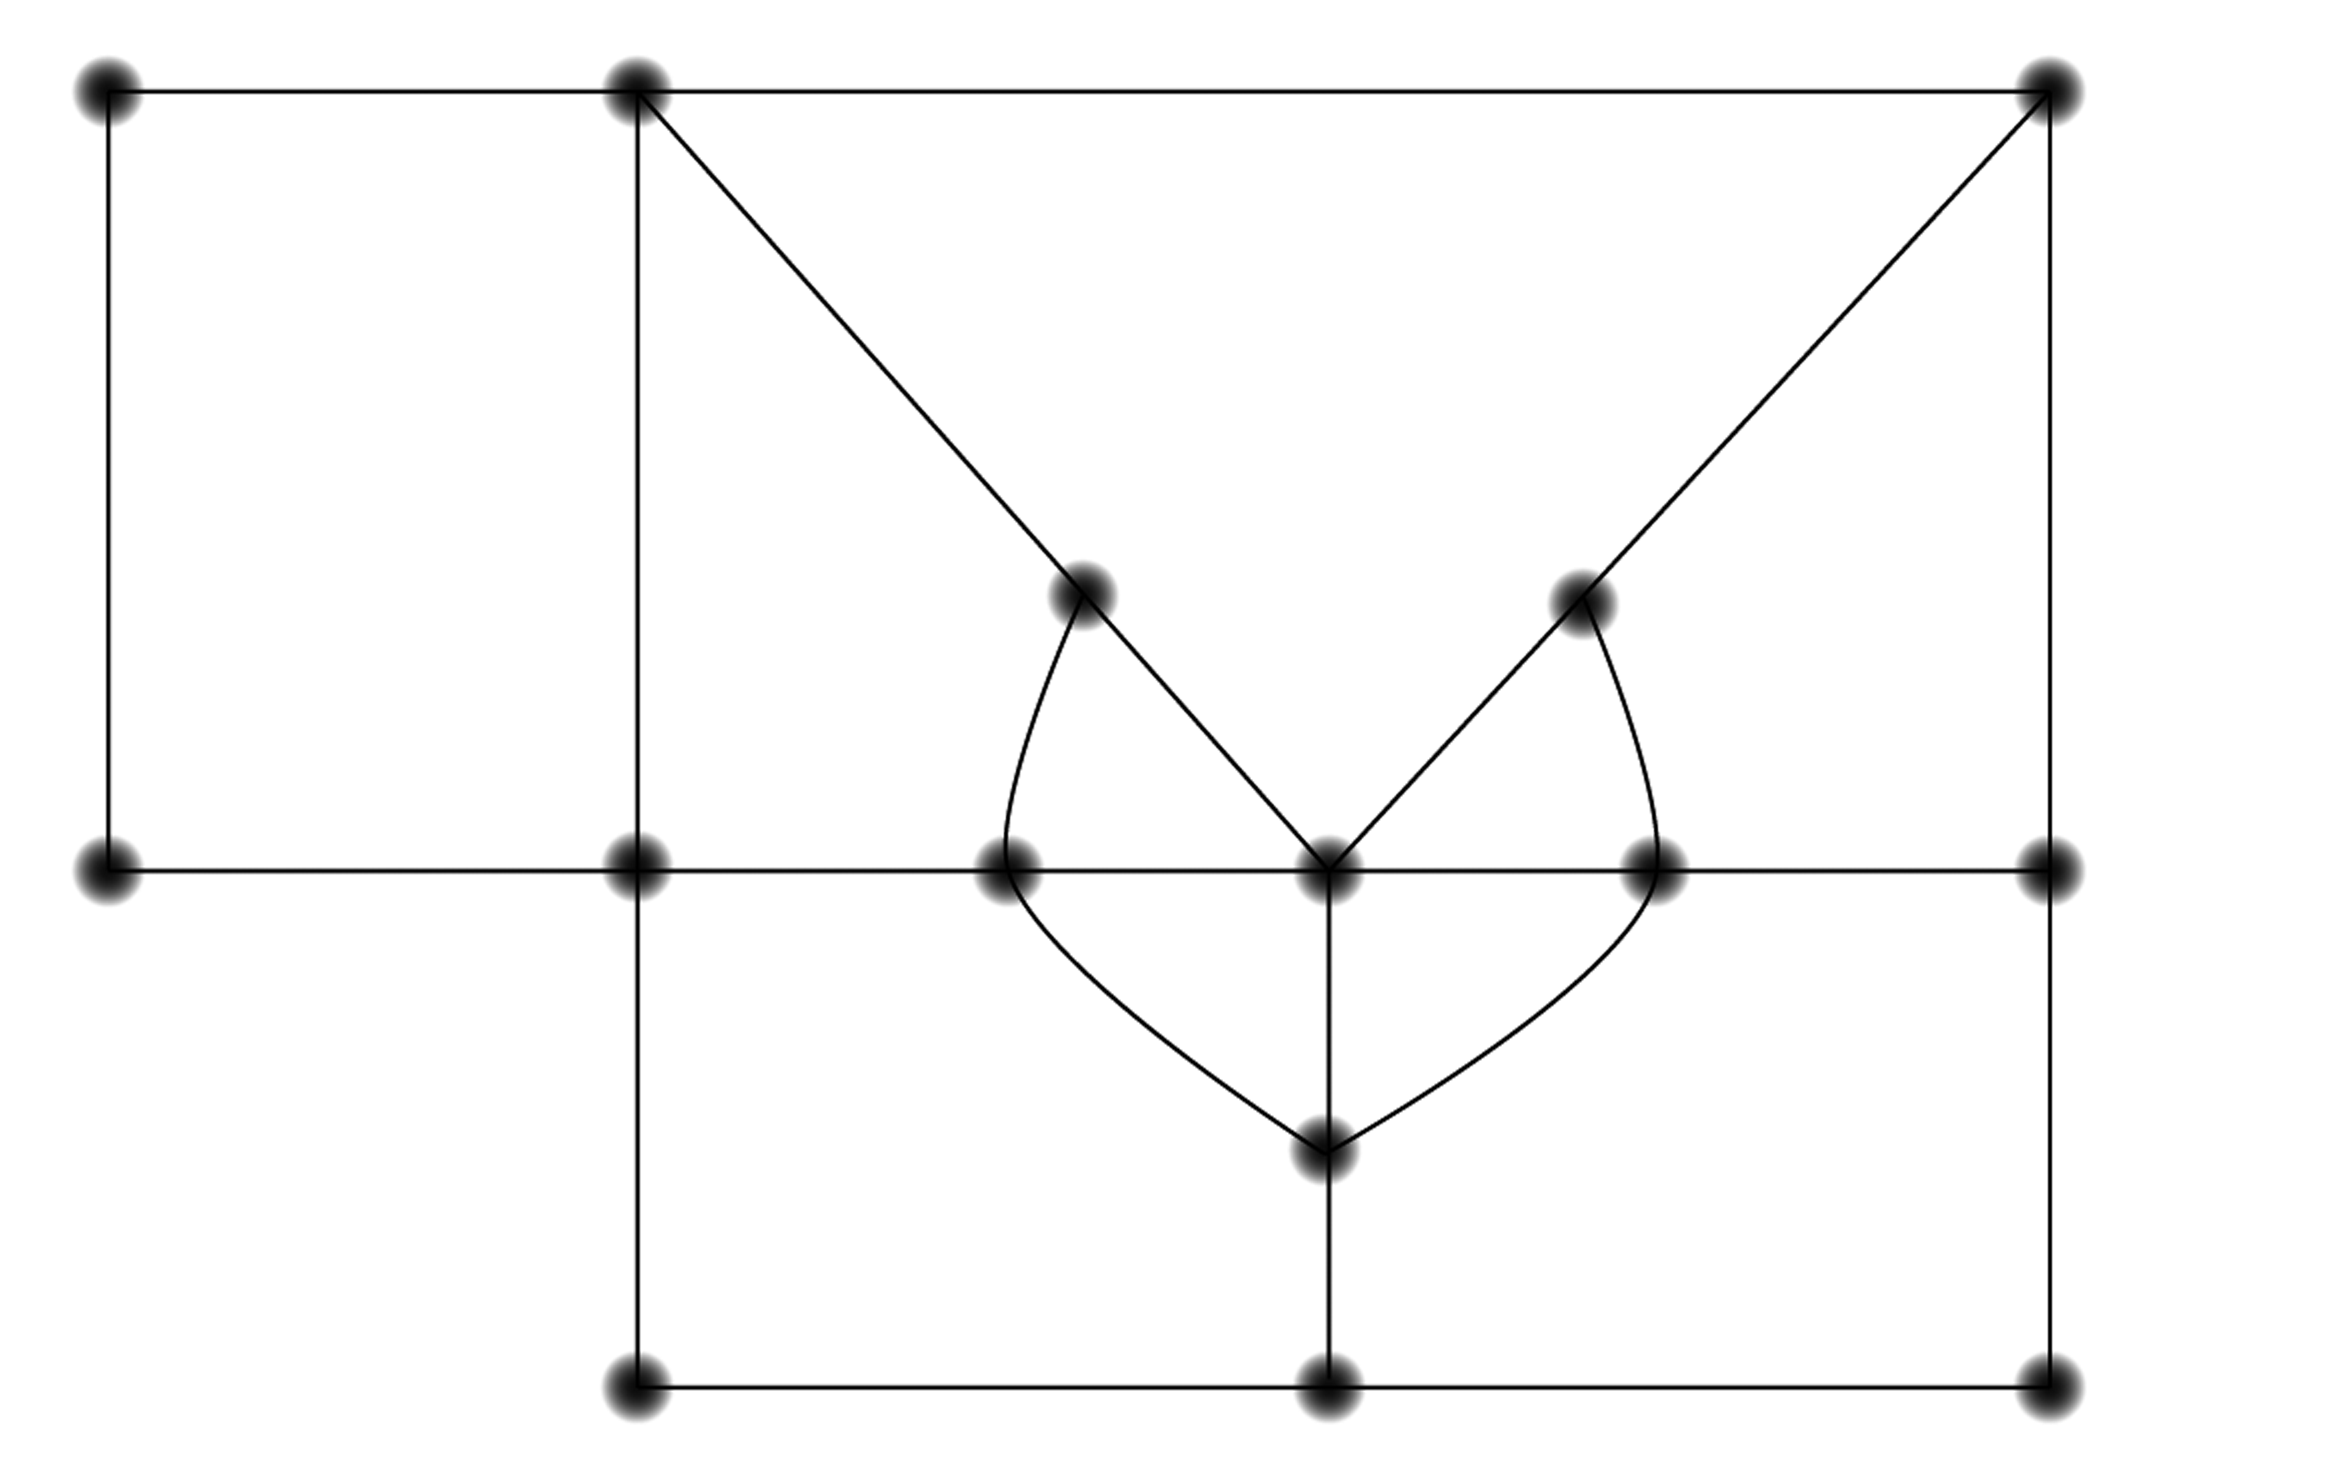
The following is a floor plan of a house. Is it possible to enter the house in room A, travel through every interior doorway of the house exactly once, and exit out of room E?

Exploring in Depth
Earlier we learned that if two graphs are isomorphic, each node has a "partner" of the same degree. Is it also true that when nodes can be matched into partners having the same degree, the two graphs must be isomorphic?
An Euler Path is a way of tracing a graph so that you trace all the edges but wind up in a different place than where you started. Which of these graphs have Euler paths?


The following diagram represents land connected by bridges. Can you walk these bridges without retracing your steps? (Though not necessarily winding up in the same place you started.)
Propose a criterion by which you’d be able to tell if a graph has an Euler path. Does it matter which nodes are your starting and ending points? Remember to examine a similar problem by making up specific cases for yourself.
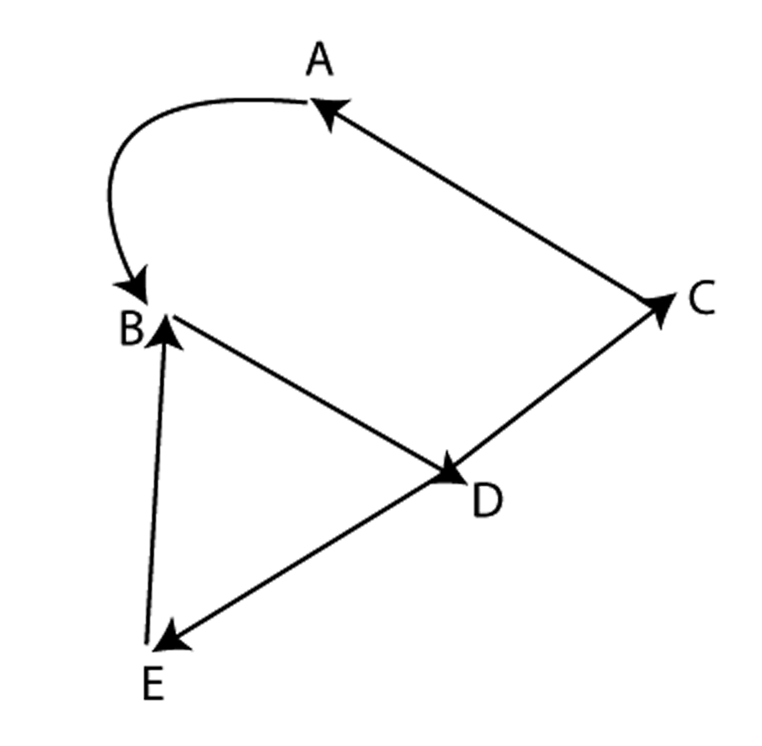
In problem 32 and the tournament
problem (see problem 48), you drew a directed graph — a graph
where the edges are one-way. The question of finding Euler
circuits is more complicated on directed graphs. Do some
experiments and propose criteria for whether a directed graph
has an Euler circuit.
Does every tournament have a Hamiltonian path? What does it mean for the team rankings if there is more than one path through a tournament?
Come up with your own system to determine the winner of a tournament. It may help to create some of your own examples of tournaments.
The following graph represents streets and corners; the portion of a street between two corners is a “block”. The neighborhood association decides to place streetlights at some of the various corners so that the neighborhood never gets too dark at night. They want there to be enough streetlights so that every home is on a block that has a streetlight on at least one of its corners. Assume that there are homes between each pair of adjacent corners. Find the smallest number of street lights needed.
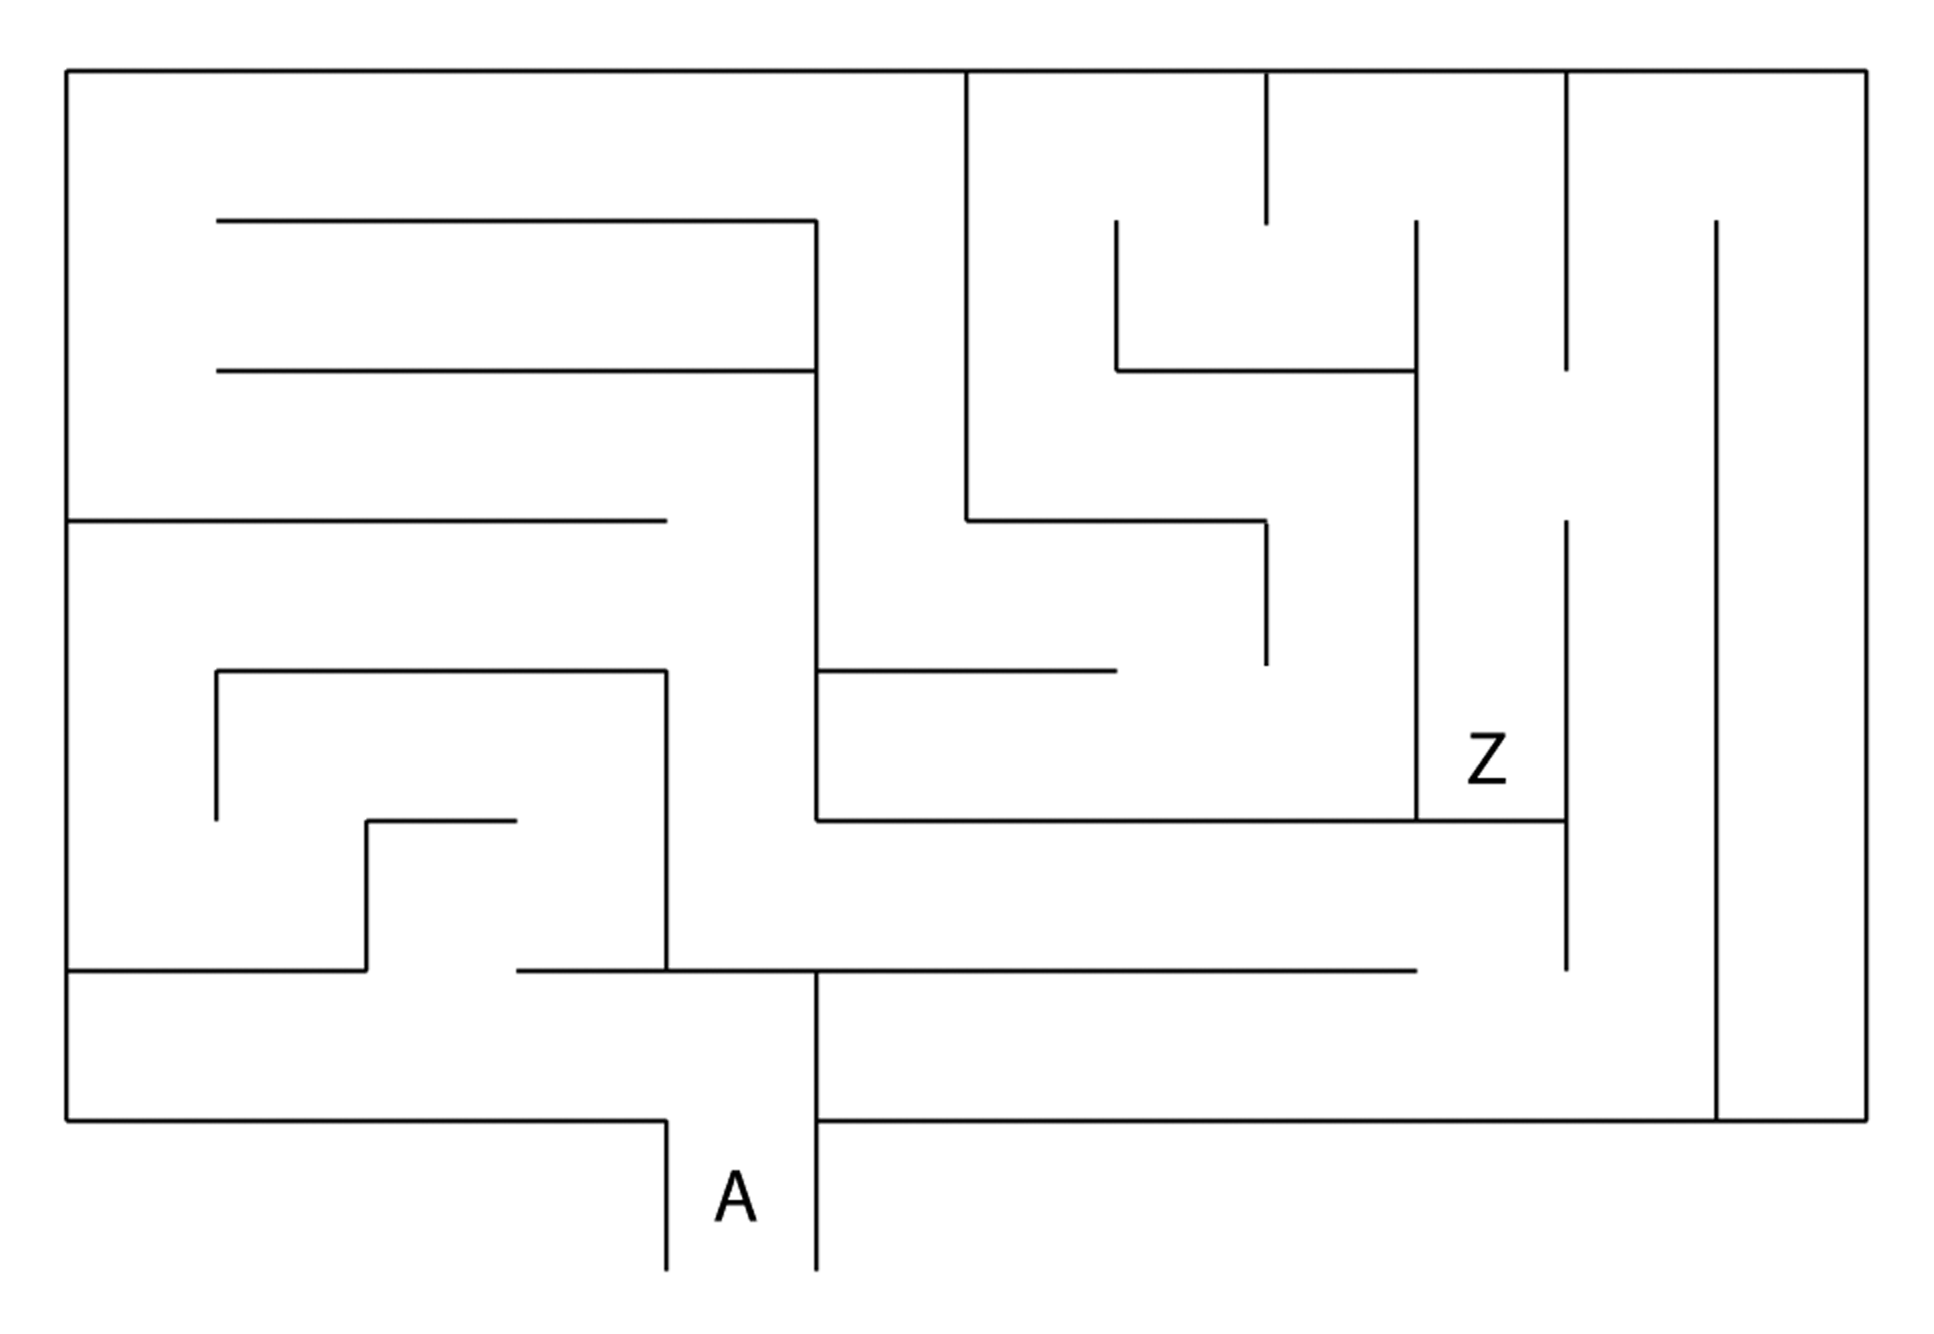
Use a graph to represent and solve the following maze.
The “doughnut” shape below is called a torus. You know you can’t draw a complete graph with five nodes on a flat surface. But can you draw it on the surface of a torus?
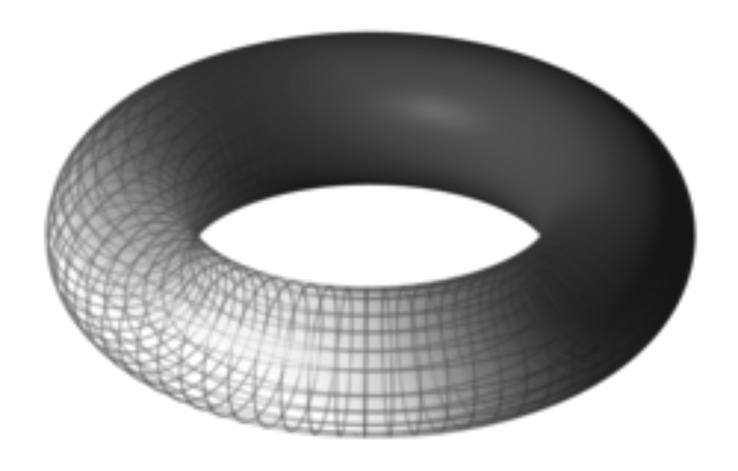
If the blueprint for the houses and utilities (see problem 43) were printed on paper shaped like a torus, could you run the wiring with no overlaps?