Introduction: How fast?
The table shown below contains data on a baseball that has been tossed into the air. For each of the times indicated, the corresponding height (above the ground) of the ball is given.
|
t sec |
0.0 |
0.1 |
0.2 |
0.3 |
0.4 |
0.5 |
0.6 |
0.7 |
0.8 |
|
h feet |
5 |
8.84 |
12.36 |
15.56 |
18.44 |
21 |
23.24 |
25.16 |
26.76 |
|
t sec |
0.9 |
1.0 |
1.1 |
1.2 |
1.3 |
1.4 |
1.5 |
1.6 |
1.7 |
|
h feet |
28.04 |
29 |
29.64 |
29.96 |
29.96 |
29.64 |
29 |
28.04 |
26.76 |
|
t sec |
1.8 |
1.9 |
2.0 |
2.1 |
2.2 |
2.3 |
2.4 |
2.5 |
2.6 |
|
h feet |
25.16 |
23.24 |
21 |
18.44 |
15.56 |
12.36 |
8.84 |
5 |
.84 |
Recall that the average speed of an object over a particular time interval is determined by the distance that it covers during that time period divided by the length of that time period. What was the average speed of the ball during the first second?
What was the average speed of the ball during the time interval from $t = 0.6$ to $t = 0.7$?
What was the average speed of the ball during the time interval from $t = 0.7$ to $t = 0.8$?
Approximately how fast was the ball going at $t = 0.7$ seconds?
Approximately how fast was the ball going at $t = 0.3$ seconds?
The average speed of the ball during the time interval $t = 0.6$ to $t = 0.7$ should have been equivalent to calculating the change in the ball’s height divided by the amount of time during this change. In other words,
$\textrm{average speed } = \textrm{ }\frac{{\textrm{change in height}}}{{\textrm{time taken}}} = \frac{{\left( {\textrm{final height}} \right) - \left( {\textrm{initial height}} \right)}}{{\left( {\textrm{final time}} \right) - \left( {\textrm{initial time}} \right)}}$.
While you may not have used this exact formula to do Problems 1-3, you probably used the reasoning encapsulated by the formula. But how did you arrive at an answer to Problem 4? Well, your answers to Problems 2 and 3 give you estimates of the ball’s speed 1/10th of a second before $t = 0.7$ seconds and 1/10th of a second after $t = 0.7$ seconds. Since the ball probably didn’t make any strange movements right at $t = 0.7$ (suddenly stop, suddenly jump up to 100 feet and instantaneously fall back to 25.16 feet, et cetera), then averaging your answers to Problems 2 and 3 would be a reasonable way of estimating the speed of the ball at $t = 0.7$ seconds. This is just one way of trying to estimate the speed of an object at a particular time. We will look at a few other ways and also see how average speed (more generally known as average rate of change) relates to some other interesting concepts.
Development
Let’s take another look at average speed and speed at a moment in time, this time by investigating an equation.
Ben has a wicked fastball — wicked in that it speeds up as it moves toward the plate. A fairly reasonable model for this pitch is $d\left( t \right) = 130{\left( 2 \right)^t} - 130$, where $d\left( t \right)$ stands for the distance (in feet) that the ball has traveled since it left Ben’s hand after t time (in seconds).
What was the average speed of the ball during the time interval from $t = 0.1$ to $t = 0.2$? If you’re not sure what to do here then think about how you did Problem 1 and how you can get this problem to be more like Problem 1.
What was the average speed of the ball during the time interval from $t = 0.2$ to $t = 0.3$?
The calculation you performed in Part b can be seen as the slope of a specific line. Explain why this is true.
Below is shown a graph of $d\left( t \right) = 130{\left( 2 \right)^t} - 130$ over the time interval $0 \le t \le 0.5$. On the axes below, carefully, and as accurately as possible, draw the line referred to in Part c. Extend the line enough so that someone looking at your work can see that the line is different from the curve.
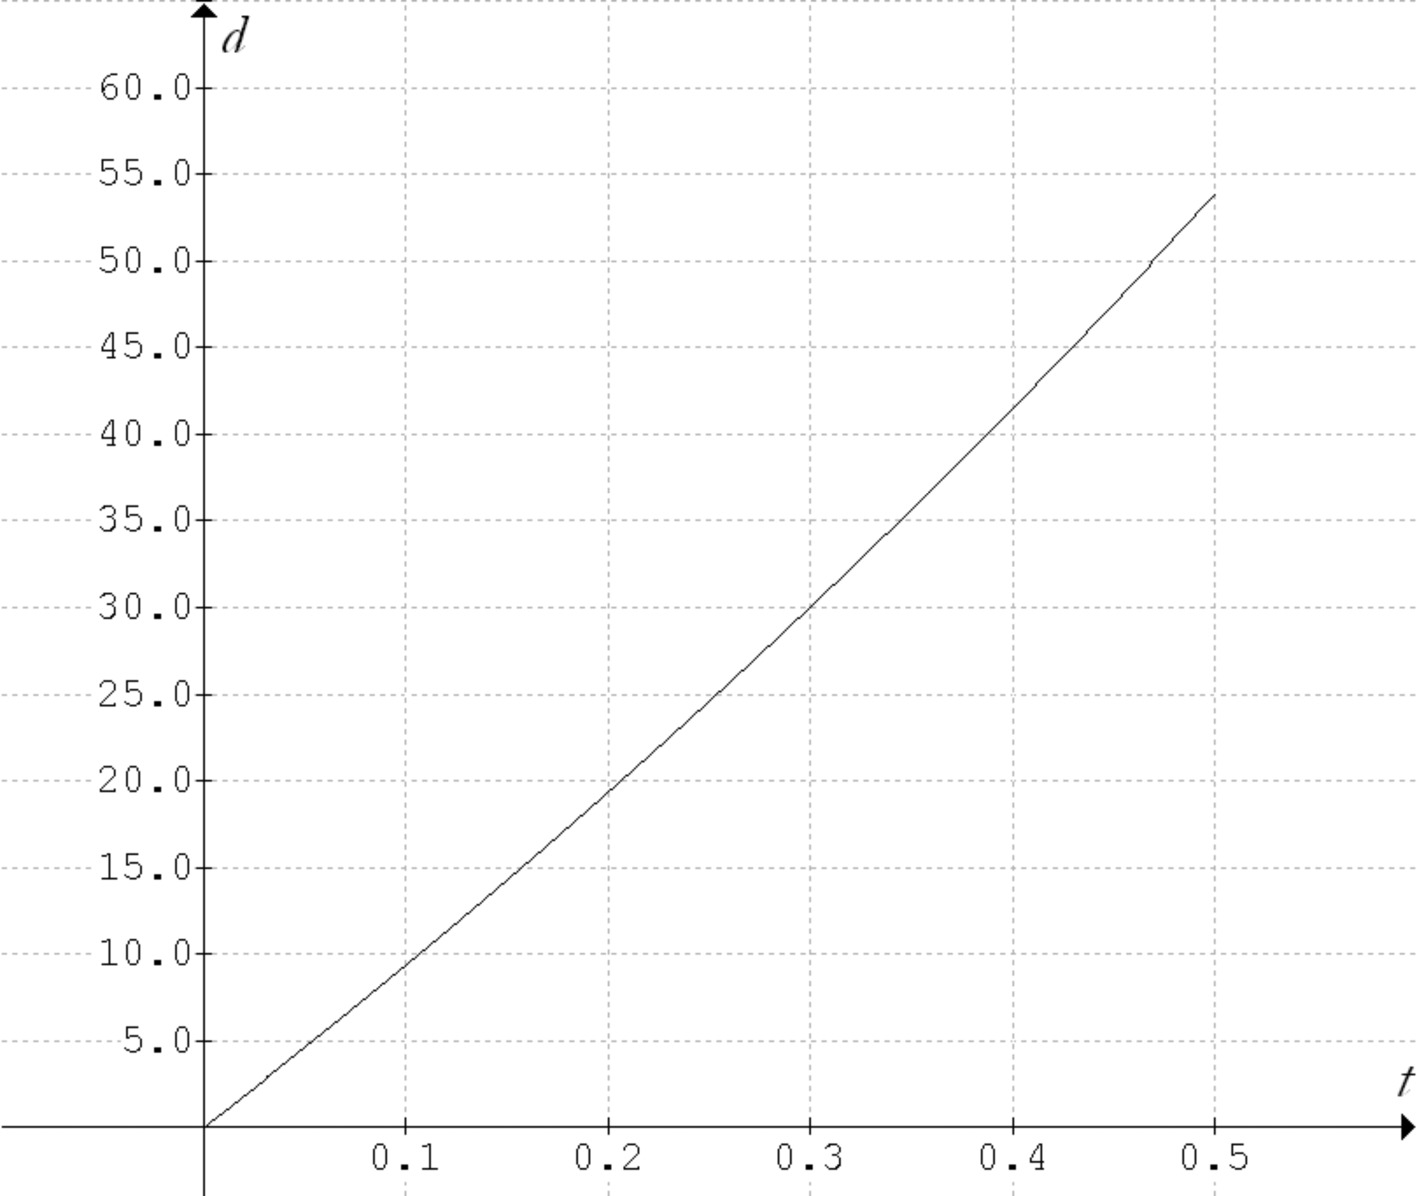
Now, repeat what you did in Part d but draw the line that corresponds to the calculation you did in Part a. Make sure someone looking at your work can tell the difference between the lines.
Approximately what was the speed of the ball at $t = 0.2$ seconds?
There is a line that just touches the graph of $d\left( t \right) = 130{\left( 2 \right)^t} - 130$ at $t = 0.2$. This line does not pass through the graph. On the axes above, draw this line. Again, make sure to draw this line so that it can be seen to be different from the other two that you drew.
Estimate as accurately as possible the slope of the line you drew in Part g. How does this slope compare to your answer in Part f?
Estimate the speed of the ball at $t = 0.3$ seconds and then again at $t = 0.4$ seconds? Is the ball speeding up?
Estimate the slope of the line that just touches the graph at $t = 0.45$. What does this number tell you about the ball?
The line that you drew in Problem 6 Part g is called a tangent line. By definition we say that the slope of a curve at a specific point is the slope of the tangent line at that point. So, the slope of the curve $d\left( t \right) = 130{\left( 2 \right)^t} - 130$ at $t = 0.2$ is approximately 103.508. Also, since the variable graphed on the vertical axis is distance and the variable graphed on the horizontal axis is time, our slope calculation
$\frac{{{d_2} - {d_1}}}{{{t_2} - {t_1}}} = \frac{{\textrm{change in distance}}}{{\textrm{change in time}}}$
gives us the speed of the ball, 103.508 feet/second (approximately 70.6 mph).
If we’re looking at a physical situation that involves distance versus time, we have seen how speed and slope of the curve are related. Let’s look at what more the slope of a curve can tell us.
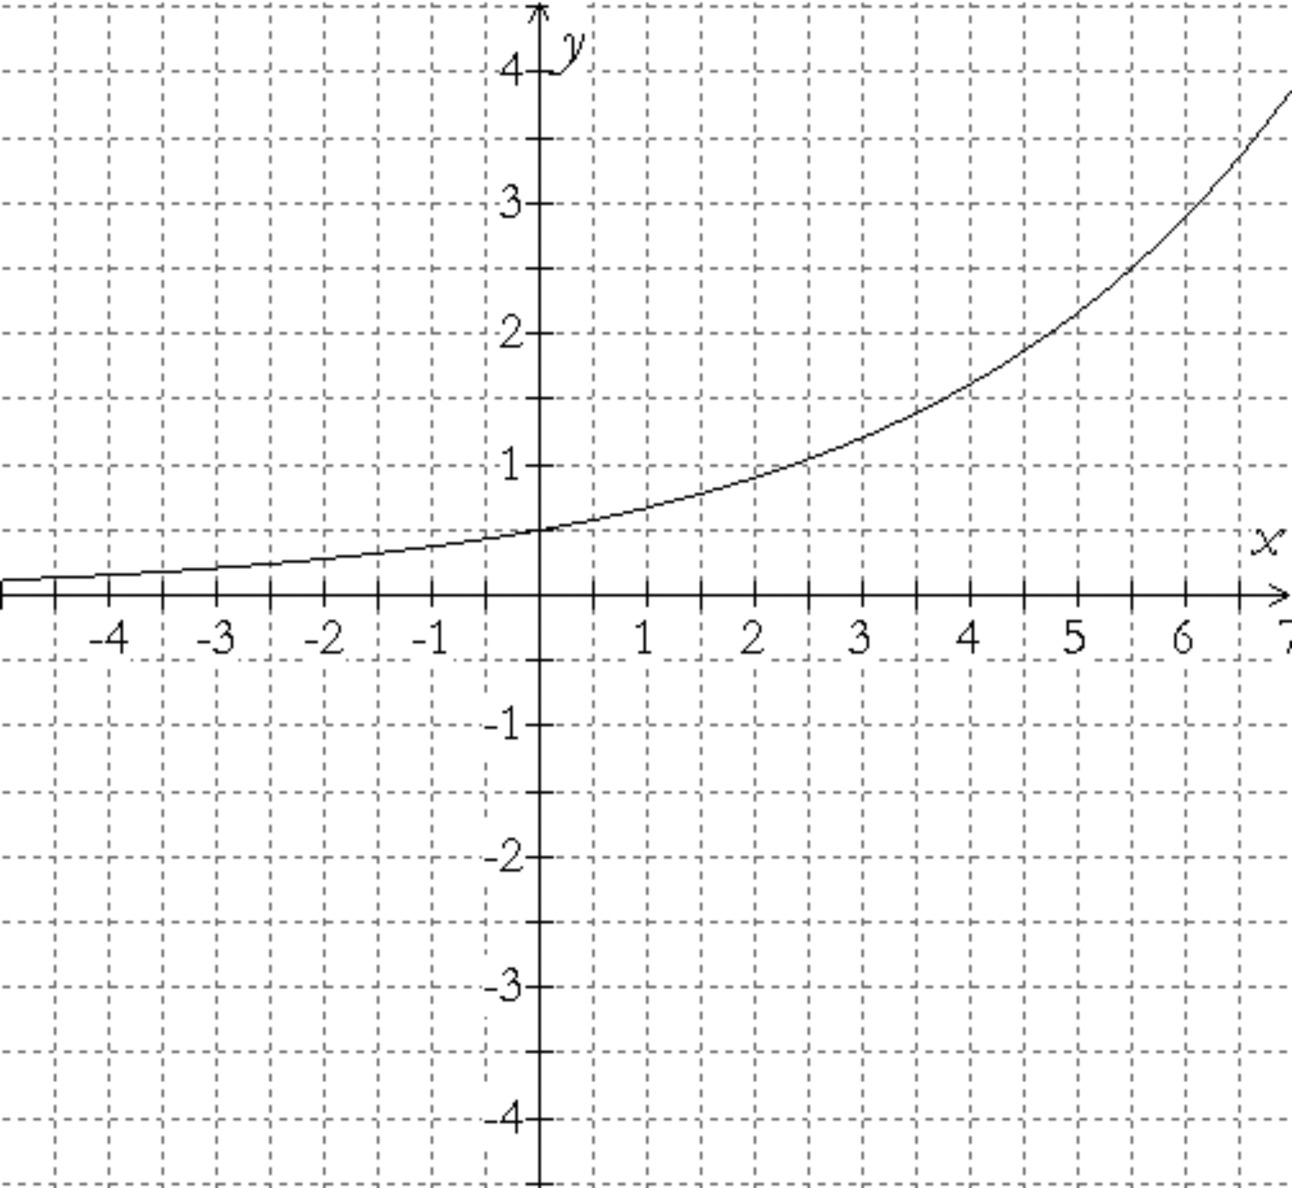
Graph the function $y = {2^x}$ on paper over the interval $- 3 \le x \le 3$.
Estimate the slope of the curve at $x = - 2,\, - 1,\,\,0,\,\,1,\textrm{ and }2$.
How will the slope of the curve change as the value of $x$ increases beyond the value of $x = 2$? How will it change as the value of $x$ decreases from $x = - 2$?
Use your calculations in Part a to explain why $y = {2^x}$ is not a linear function.
Graph the function $y = {0.7^x}$ on paper over the interval $- 3 \le x \le 3$.
Calculate $\frac{{{{0.7}^{2.001}} - {{0.7}^2}}}{{2.001 - 2}}$ and explain the meaning of this number in the context of this problem.
Is it reasonable to think of your calculation in Part a as an estimate of the slope of the curve at $x = 2$? How can you get an even better estimate?
Estimate the slope of the curve at $x = - 2,\, - 1,\,\,0,\,\,1,\textrm{ and }2$.
Write an expression that would represent an estimate of the slope of the curve at $x = b.$ This expression should have $b$ along with some constants.
Looking back at your solution to Part d, for what value(s) of $x$ is the slope of the curve less than -1?
Are there any values for $x$ for which the slope of the curve is 0? You might visualize what the tangent line would look like in order to solve this problem.
Your work in Problems 7 and 8 should have given you some idea of how you can use the slope of a curve to determine whether the curve is linear. Also, how the slope of the curve changes can give you some sense of what is happening to the curve.
We will add only one thing more to our understanding of the slope of the curve.
A rabbit population is growing according to the model $R(t) = 200{(1.02)^t}$, where t is measured in days.
Estimate the slope of the curve at $t = 3$. What does this number tell you about the rabbit population? Be specific.
At what rate (rabbits/days) is the population increasing at 6 days?
What is the daily percentage growth rate of the rabbit population?
Why are your numerical answers to Parts a, b, and c all different from each other?
As you may have surmised from the previous problem, “growth rate” is a somewhat ambiguous term: you need to know whether the rate is a percentage growth rate (your answer to Part c and the number that is built into the model) or an absolute growth rate (your answers to Parts a and b). Moreover, the slope of the curve tells you how two quantities change with respect to each other, not necessarily how one quantity changes with respect to itself, which is what percentage change has to do with.
Practice
A ball is dropped from the top of a building. Its height $h$ (in meters) at time $t$ (in seconds) is given by the function formula $h(t) = - 4.9{t^2} + 80$.
What was the average speed of the ball during the time interval from $t = 1$ second to $t = 1.3$ seconds.
Estimate the speed of the ball at 1.5 seconds.
Shown below is a graph of $y = 0.5 \cdot 1.34^x$.
Draw, as accurately as possible, the tangent line to the curve at x = 3.
Estimate the slope of the line that you drew in Part a.
Estimate the slope of the curve at x = 3.
You accidentally inhale a toxic gas. The concentration C(t) (in micrograms per milliliter) of poison in your blood at time t (in hours) is given by $C(t) = 3.72({0.9359^t})$.
Determine the slope of the curve described by $C$ at $t = 2$ hours.
What does the slope that you calculated in Part a tell you about the concentration of poison in your blood? What are the units for this slope?
What is the percentage growth or decay rate of the concentration of poison in your blood?
Problems
Throughout the problems in this section and the next, you’ll need to pay close attention to the information presented, particularly what is implied by the information. For example, when you’re told that the ball has hit the ground, this should mean to you that its height is zero, and you can bring this information into your calculations. Thinking carefully about the implications of the terms and information in a problem is part of our habit re-examine the problem and will come in handy in solving many problems.
A baseball is shot from a cannon so that its height $h$ (in feet) above the ground at time $t$ (in seconds) is given by $h(t) = -16t^2 + 128t +4$.
Determine the speed of the ball when it hits the ground. Use 2-decimal place accuracy.
Determine the speed of the ball when it reaches its highest point.
The table below shows the populations over time of two species that occupy the same area: rabbits and wolves. Counts are taken at the beginning of each year.
Calculate the average increase in the wolf population over the first 4 years.
Calculate the average decrease in the rabbit population during the 3 years that start with the beginning of the 19th year.
Approximately what was the rate of change (wolves per year) of the wolf population at the beginning of year 20?
Indicate the longest time period over which both species simultaneously have a positive growth rate.
Indicate the longest period over which one species has a positive growth rate while the other has a negative growth rate.
When is the first time that the rabbits have zero growth rate? What is happening with the other species and why might this be happening?
|
Year |
1 |
2 |
3 |
4 |
5 |
6 |
7 |
8 |
9 |
10 |
11 |
12 |
13 |
14 |
15 |
|
Rabbits |
1599 |
2362 |
2803 |
2229 |
1206 |
594 |
338 |
239 |
210 |
223 |
275 |
382 |
580 |
925 |
1486 |
|
Wolves |
43 |
54 |
80 |
118 |
140 |
135 |
118 |
99 |
82 |
68 |
57 |
48 |
43 |
40 |
42 |
|
Year |
16 |
17 |
18 |
19 |
20 |
21 |
22 |
23 |
24 |
25 |
26 |
27 |
28 |
29 |
30 |
|
Rabbits |
2241 |
2790 |
2387 |
1352 |
662 |
365 |
249 |
212 |
218 |
263 |
360 |
540 |
856 |
1379 |
2115 |
|
Wolves |
51 |
75 |
112 |
138 |
137 |
121 |
102 |
85 |
70 |
58 |
50 |
43 |
40 |
41 |
49 |
The following table is for a function $y = {b^x}$.
|
$x$ |
-2 |
-1 |
0 |
1 |
2 |
|
approximate slope at $x$ |
.184 |
.304 |
.5 |
.826 |
1.363 |
Sketch a reasonable graph for the function.
Estimate the value of $b$. Show your work or explain how you arrived at your solution.
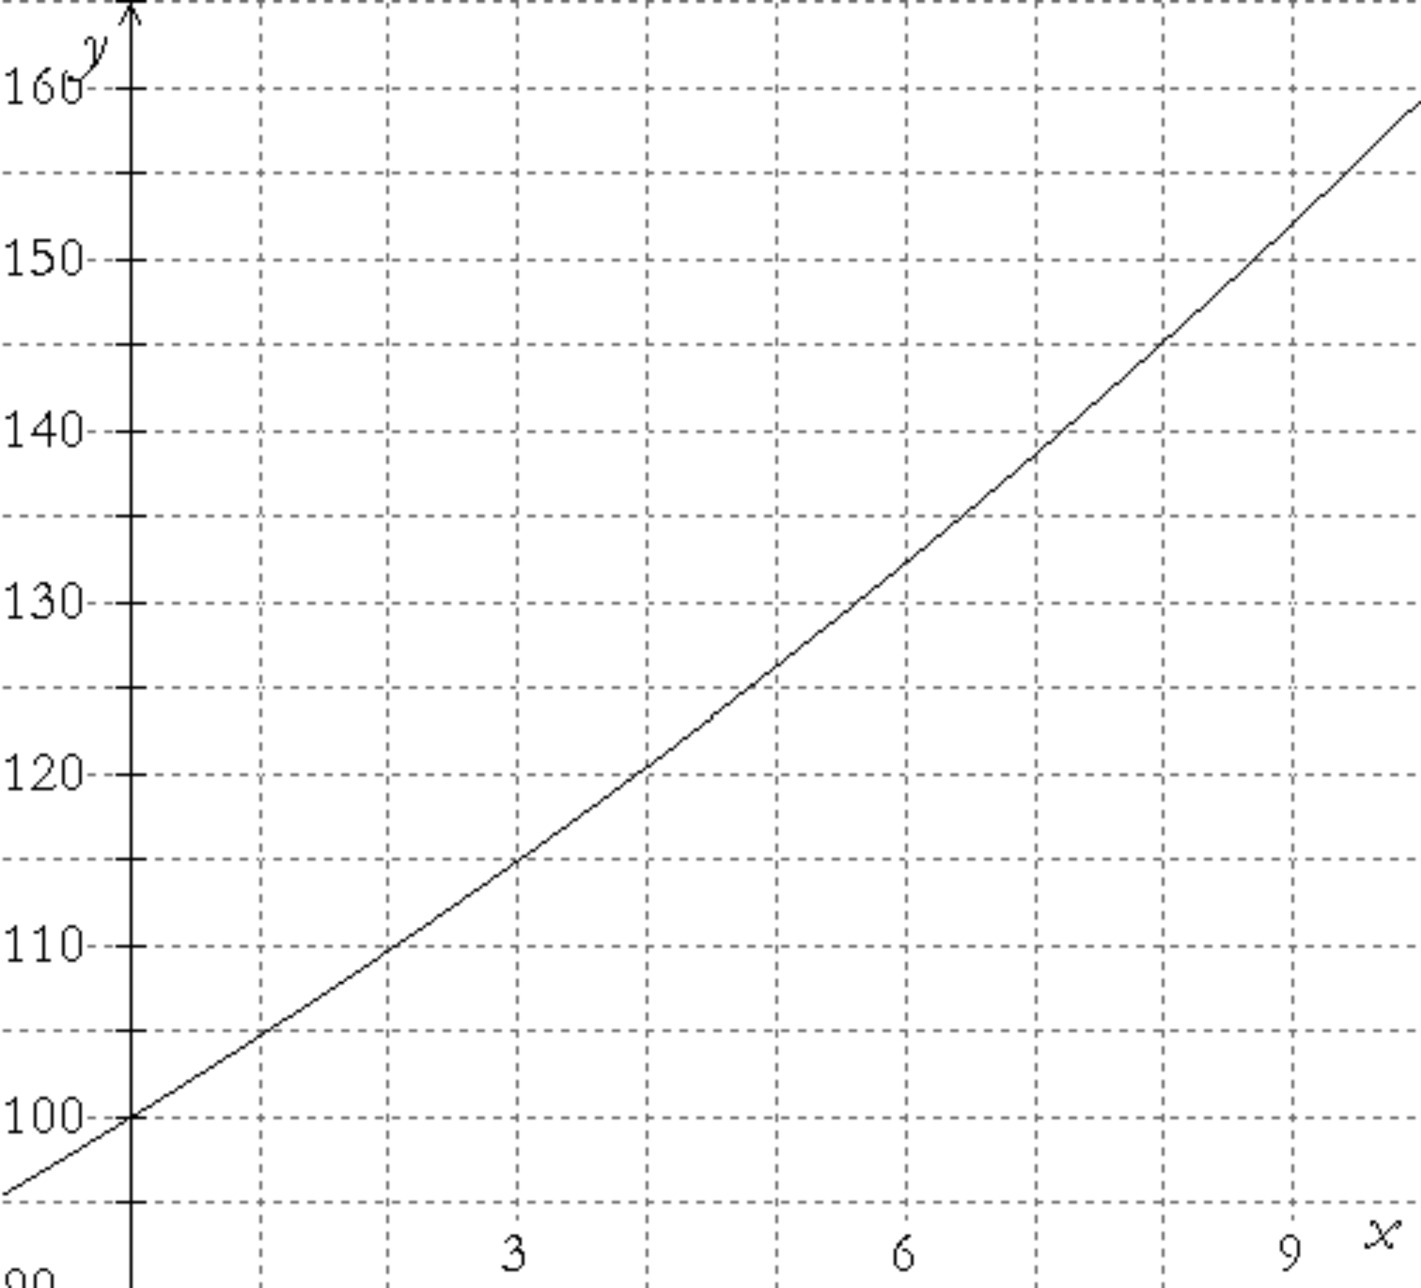
The graph of a function $f(x) = a \cdot {b^x}$ is shown below. As accurately as possible estimate the slope of the curve at $x = 3$ and at $x = 6$.
Let $g(x) = 2 \cdot ({0.5^x})$. Calculate $\frac{{g(2 + h) - g(2)}}{h}$, where $h = 0.001$. What does this calculation tell you about the function $g$? Can you come up with an even better estimate in this situation?
A bacterium population has been decreasing exponentially. Twenty hours ago the population was 1 million. Ten hours later the population had dropped to half a million. Suppose the bacterium population continues to drop off at the same rate.
Write an equation that models the bacterium population.
What is the percentage hourly decay rate of the population? Use 2-decimal place accuracy.
Exactly ten hours ago, what was the population decay rate (in bacteria per hour)? Use 3-decimal place accuracy.
Five hours ago would the population decay rate (in bacteria per hour) have been smaller (in magnitude) than your answer to Part c, larger than it, or effectively the same? Answer this question without doing any calculations. Explain how you arrived at your answer.
In how many hours will the population drop to one bacterium? Use 3-decimal place accuracy.
On a mathematics quiz the following problem was presented:
Calculate $\frac{{{2^{2.2001}} - {2^{2.2}}}}{{.0001}}$ using 3-decimal place accuracy and explain the meaning of this number.
In response to this question, Jessica wrote, “3.185; It’s the approximate slope of the curve $y = {2^x}$ at $y = 2.2$. David wrote, “3.185; It’s the approximate slope of the curve $y = {2^x}$ at $x = 2.2001$.” Meredith wrote, “3.185; It’s the approximate slope of the curve $y = {2^x}$ at $x = 2.20005$.” How would you grade their responses?
Tony wishes to estimate the slope of the tangent line to the curve $y = 12{(1.3)^x}$ at $x = - 1.25$. He wants to write a fraction that will complete this task and have $0.0001$ in the denominator. Write a fraction that will work for him. Now, write another fraction that will work. Write one more.
Peter says that $\frac{0}{0}$ is equal to 17! Here’s his argument: another way of writing $5 \times 6 = 30$ is to say that $\frac{{30}}{6} = 5$. Therefore we can say that another way of writing $17 \times 0 = 0$ is that $\frac{0}{0} = 17$. Do you agree with Peter, or not? Explain!
Robert and Allan each throw a baseball at the same time. The height (in feet) of Robert’s ball above the ground after t seconds is given by $R(t) = - 16{t^2} + 50t + 5$. The formula for Allan’s ball is $A(t) = - 16{t^2} + 60t + 4$.
What is the average (vertical) speed of Robert’s ball during the first second?
Estimate the speed of Allan’s ball at 1 second.
Is there a time when both balls have the same speed?
Let $f(x) = \sqrt {25 - {x^2}} $.
Explain why the graph of $f$ is a semicircle. What is the radius of the semicircle?
First find the slope of $f$ at the point $(4,3)$. Then find an equation for the line tangent to the graph going through this point.
Find an equation for a line perpendicular to the tangent line, also passing through the point (4,3). Before you do, would you predict that this line crosses the $x$-axis to left of (0,0), to the right of (0,0), or that it goes through (0,0)?
Exploring in Depth
Let $f(x) = \sqrt x $ and $g(x) = 4 - 4({0.5^x})$.
Kiran was calculating the slope of f at x and thought he could express his answer in two equivalent ways: $\frac{{\sqrt {x + .001} - \sqrt x }}{{.001}}$ and $\frac{{\sqrt x + \sqrt {.001} - \sqrt x }}{{.001}}$. Give two explanations for why these expressions are not equivalent: one involving algebra and the other involving slope.
Kiran then calculated the slope of $g$ at $x$ and wrote $\frac{4-4(0.5^{x+.001}) - (4 - 4(0.5^x))}{.001}$. Show how this expression can be rewritten as $\frac{4(0.5^{x+.001})(1-4(0.5^x))}{.001}$.
As $x$ increases, what happens to the slope of $f$? of $g$?
Kiran argues that, given what’s happening in Part c, both functions should be doing essentially the same thing as $x$ goes toward infinity. What do you think?
Speed and velocity are not synonyms. “What?!” you say. Velocity is speed with direction. For example, if you go forward with a velocity of 5 yd/sec, stop, and then go backwards with a speed of 3 yd/sec, your velocity while going backwards was -3 yd/sec, where the negative merely indicates that you are going in the direction opposite to the positive direction.
Let $h(t) = - 16{t^2} + 60t + 4$ describe the height, in feet, of a ball above the ground at t seconds. Estimate the velocity of the ball at $t = 1$ second and at $t = 3$ seconds.
Acceleration is defined to be the change in velocity over the change in time. For the ball in Problem 25, estimate its acceleration at $t = 1$ second.
Let $f(x) = {2^x}$.
Complete the table below using 3-decimal place accuracy.
|
$x$ |
0 |
0.1 |
0.2 |
0.3 |
0.4 |
0.5 |
0.6 |
0.7 |
|
Slope of $f$ at $x$ |
On a coordinate axis system plot the ordered pairs from the completed table in Part a. Draw a smooth curve through these points.
Estimate the slope of the curve you drew in Part b at $x = 0.5$. What does this number tell you about the original curve $f$ at $x = 0.5$?
Don’t use a calculator for this problem.
Simplify $\frac{{\sin 135^\circ + \cos 135^\circ }}{{\tan 135^\circ }}$.
Subtract $\frac{{x + 3}}{6} - \frac{{x - 5}}{8}$.
Simplify $\frac{{{{({x^2}y)}^{ - 2}}{x^3}z}}{{{x^4}{{(y{z^2})}^3}}}$.
Solve for $x$ if $|x - 8| \le 16$.
Solve for $x$: $x = \frac{1}{{x + 1}} + \frac{3}{{2x + 2}}$