Introduction
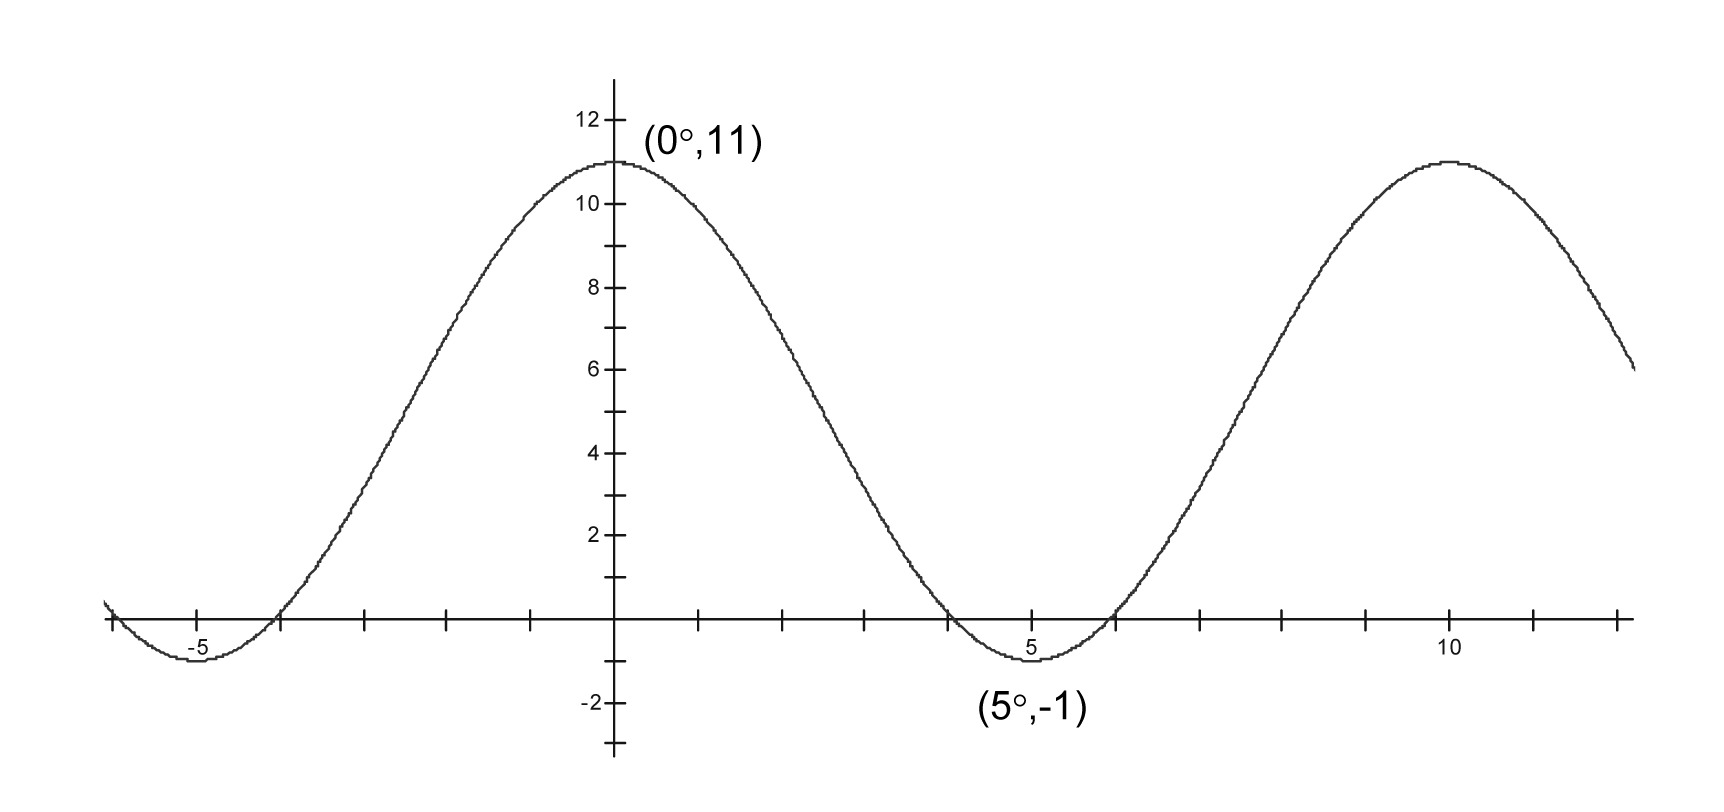
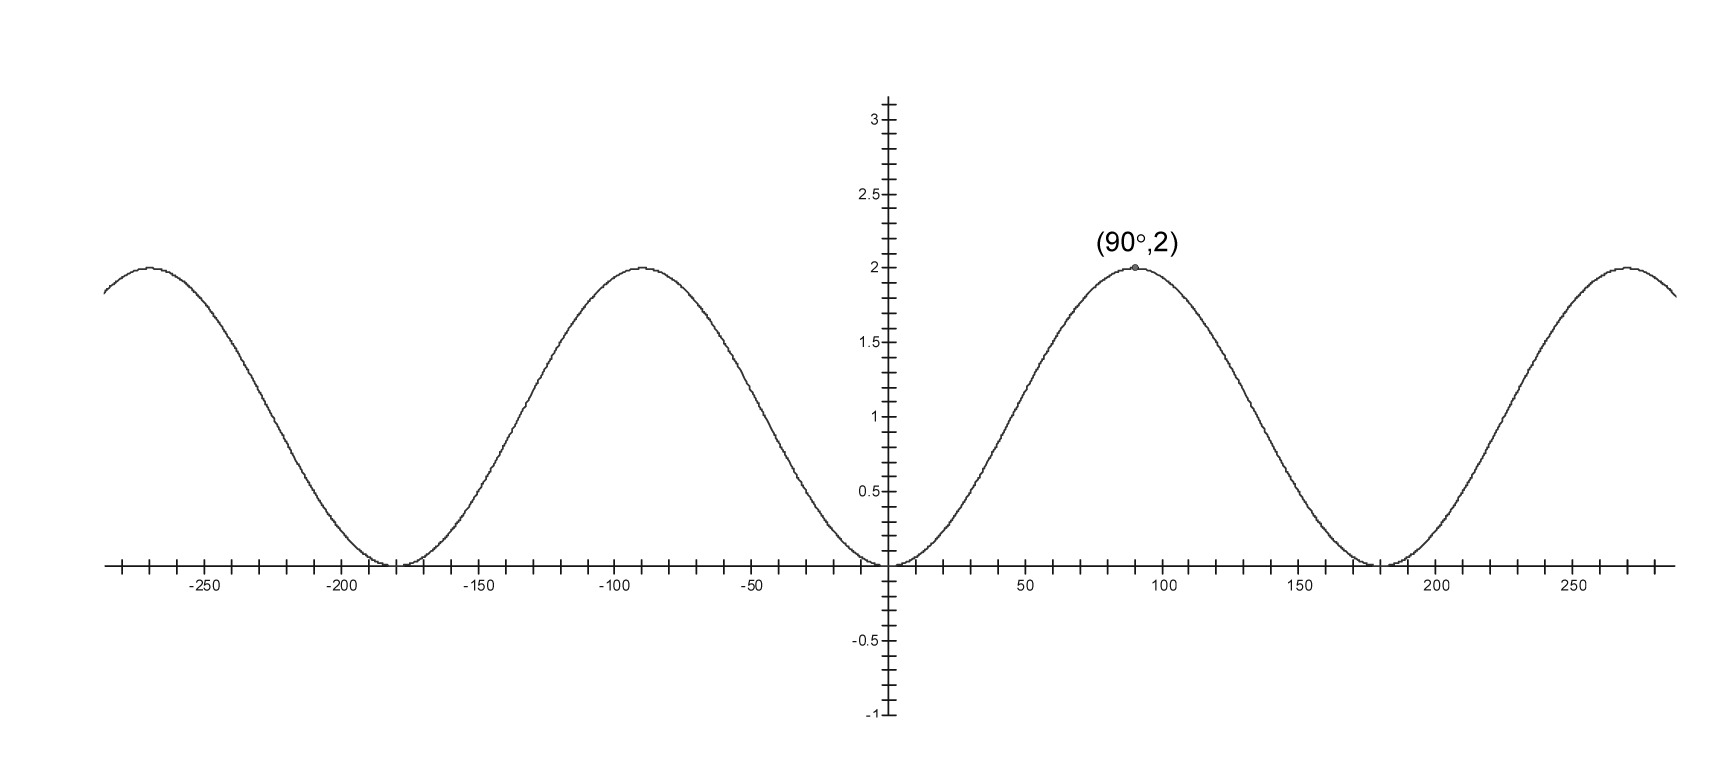
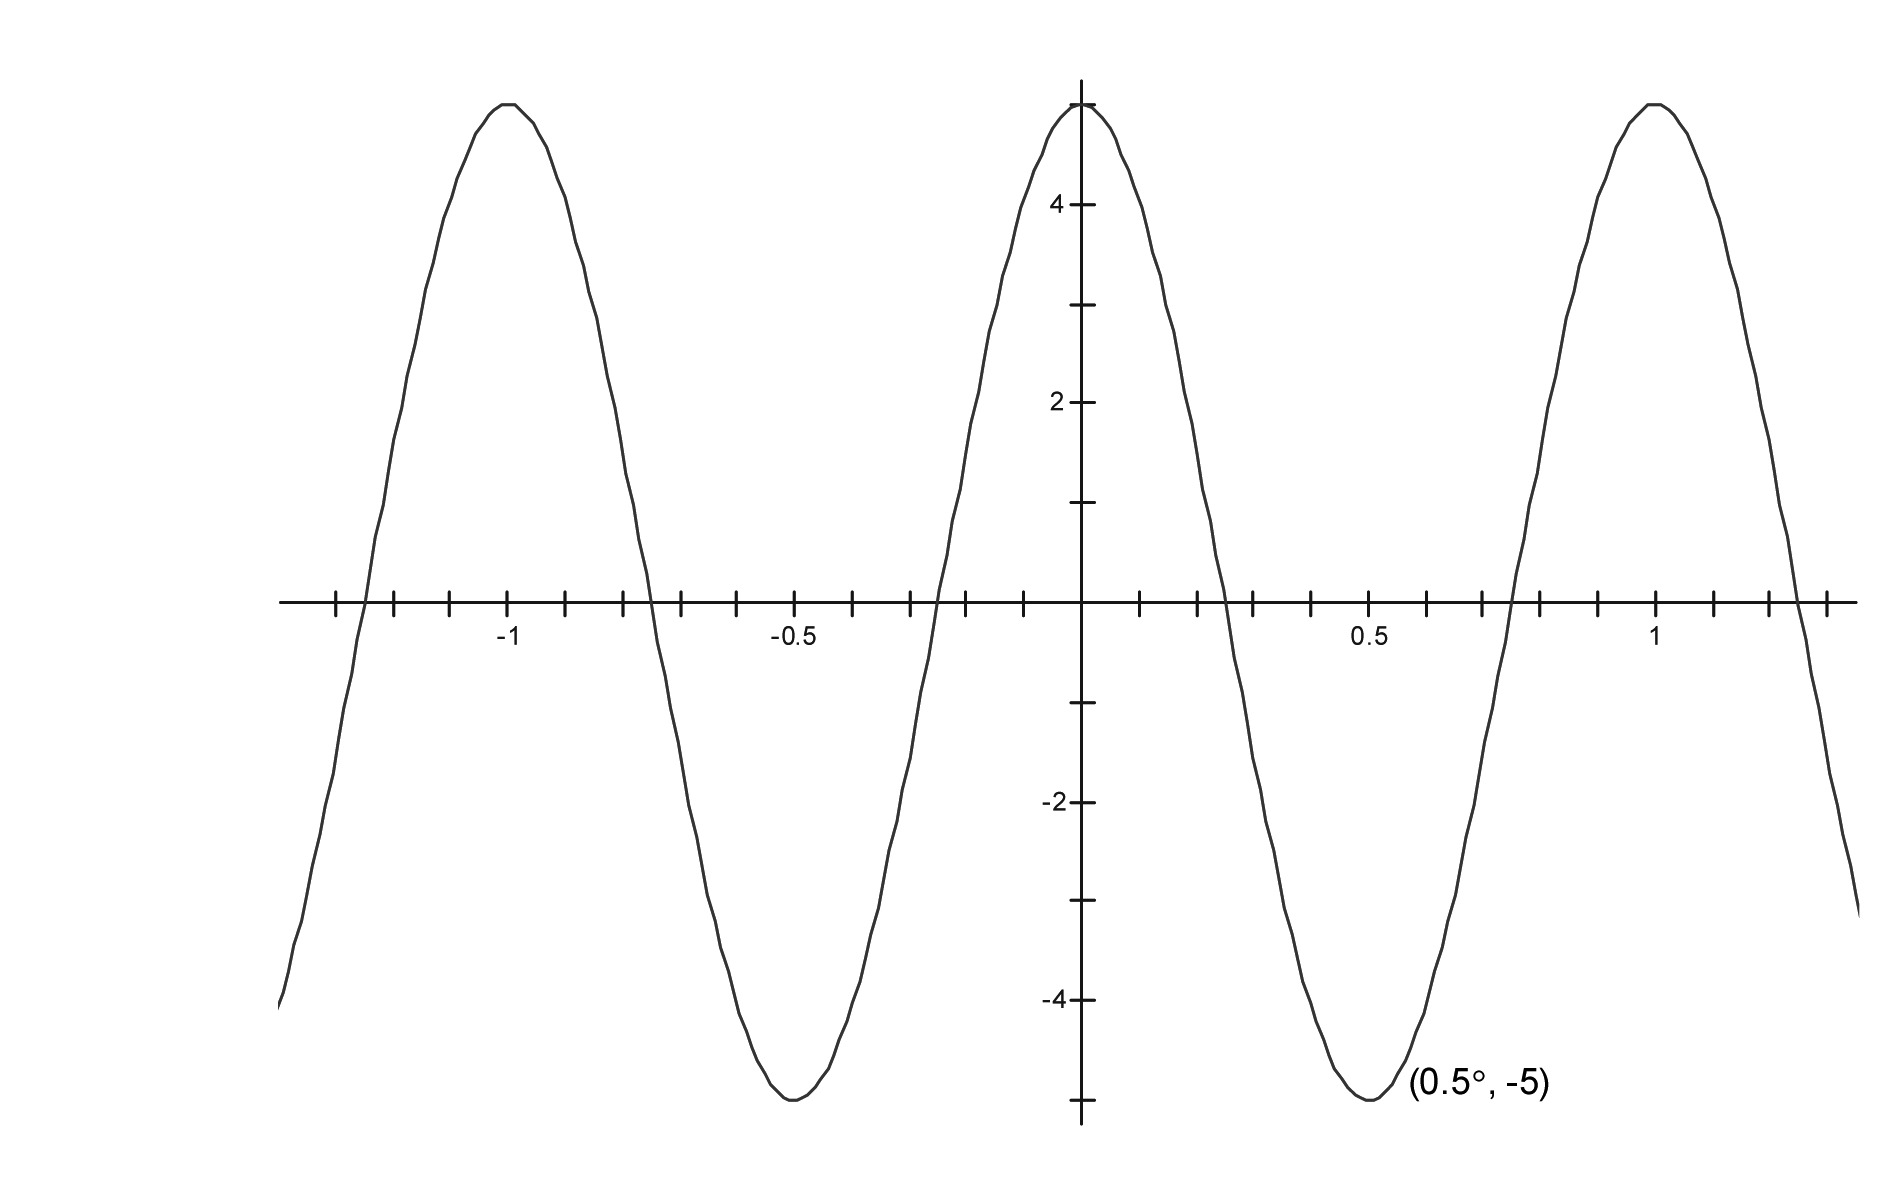
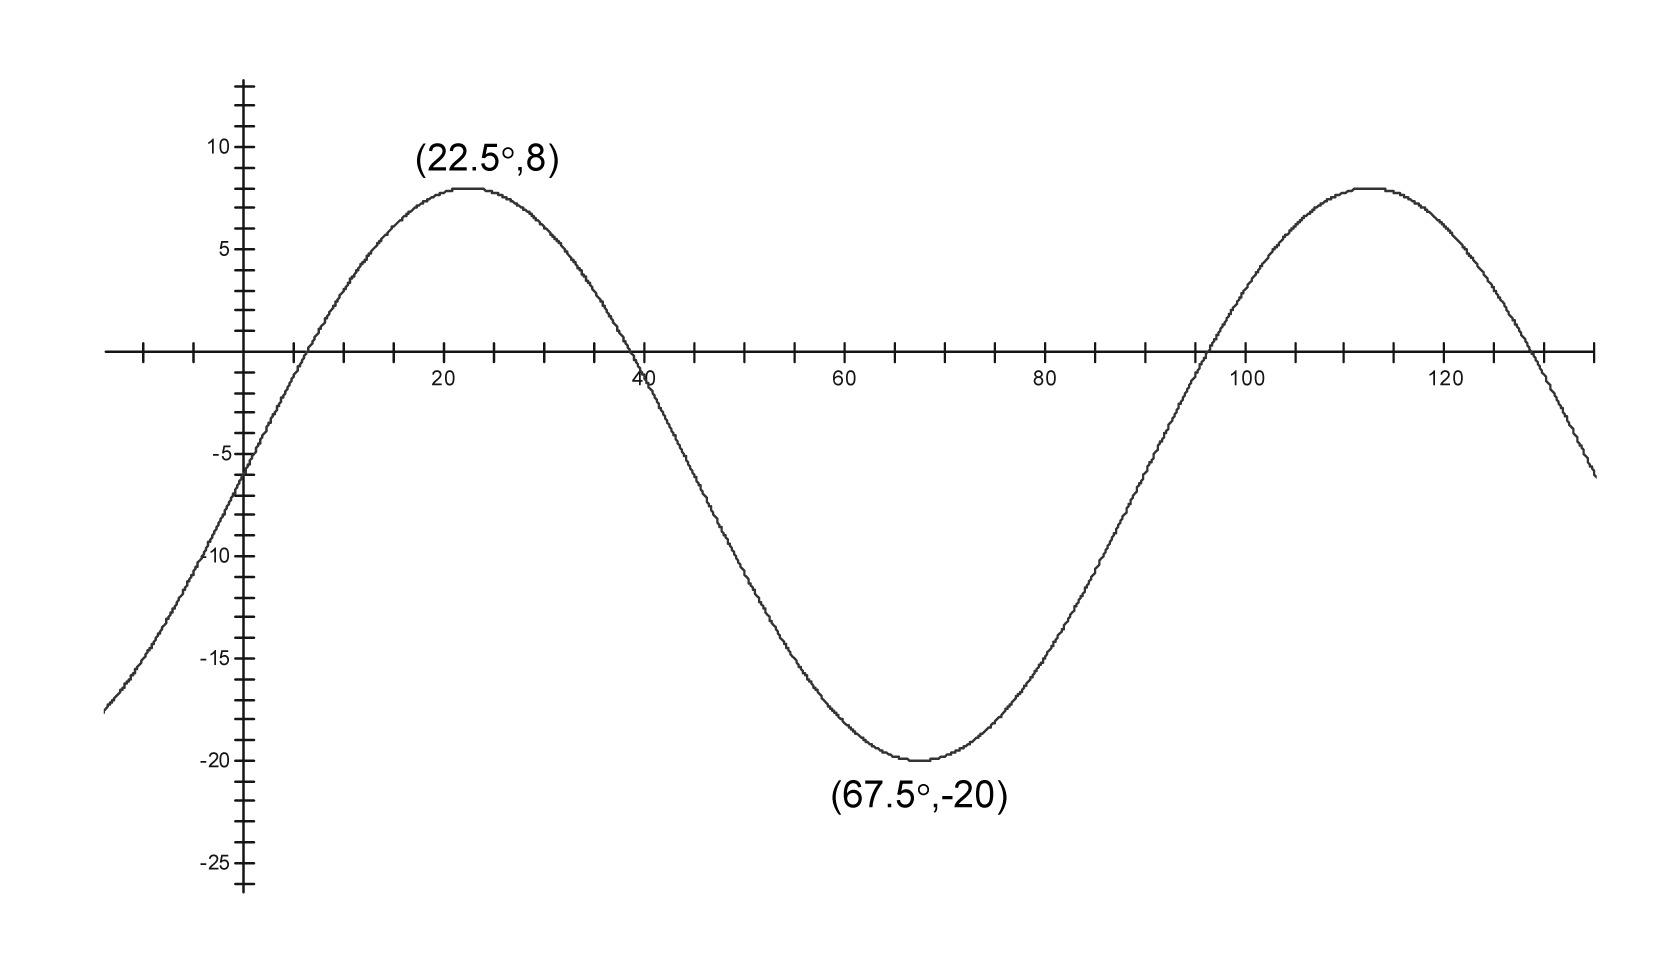
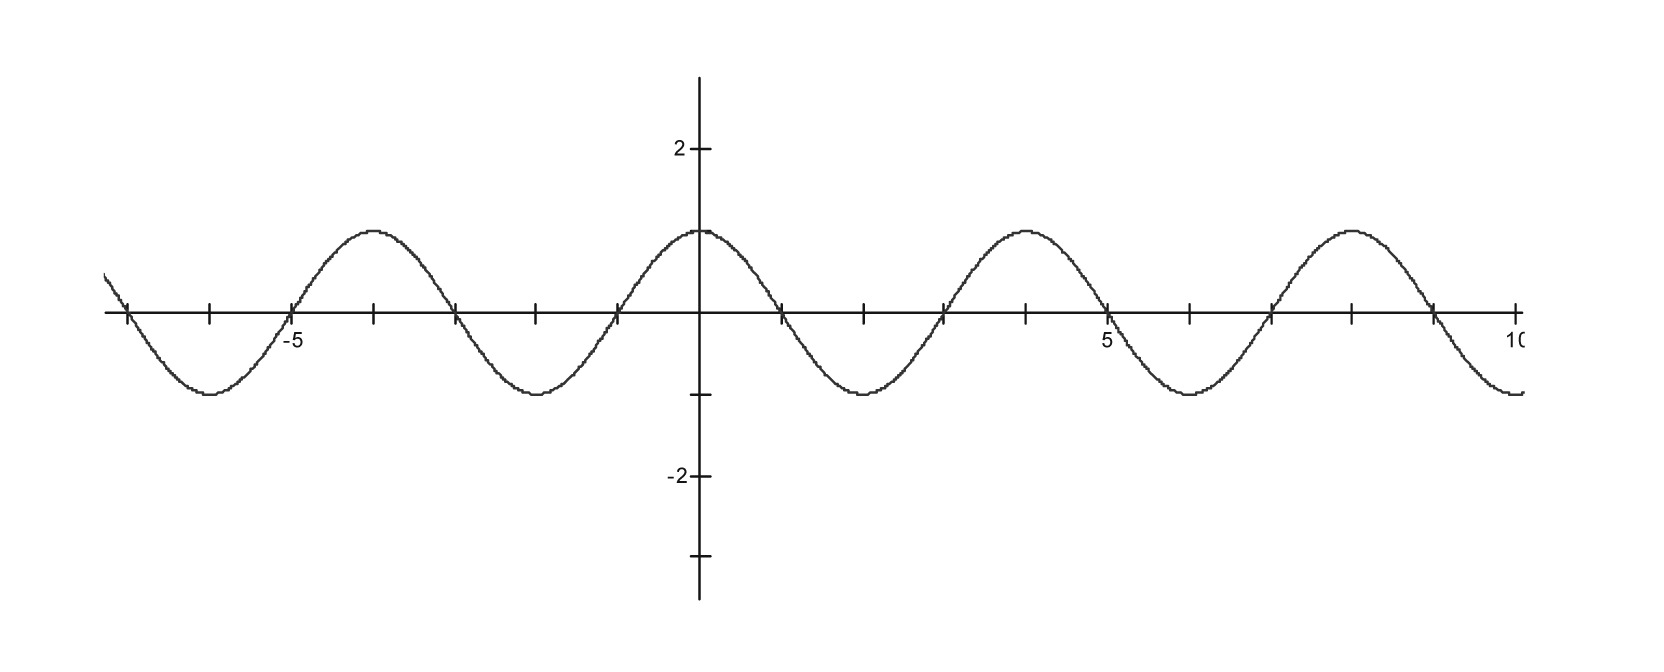
The graph of the sine and cosine functions are very distinctive looking.
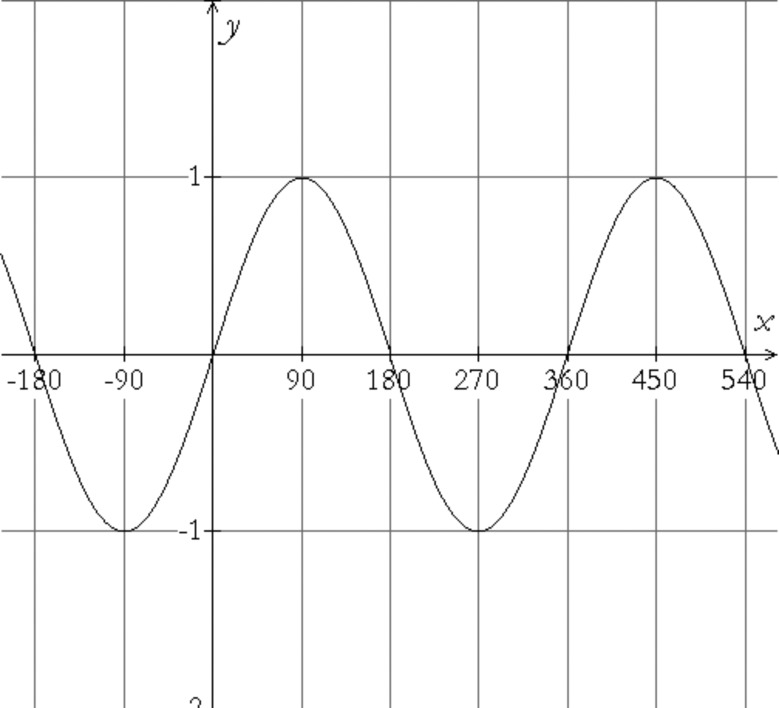
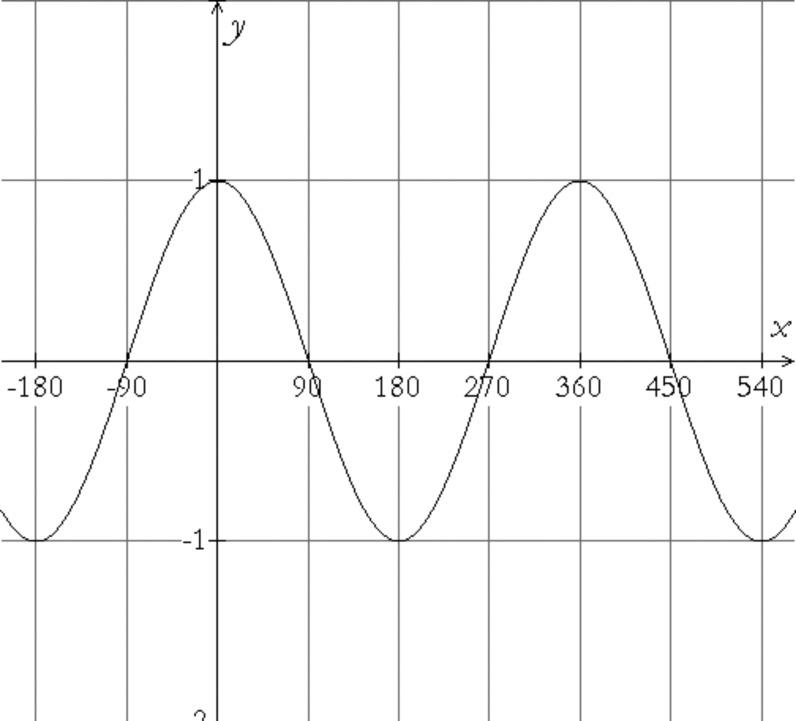
Which of the figures above is $y = \sin x$? Which is $y = \cos x$?
Using your knowledge of trigonometry, find coordinates for
a few of the high and low points for each graph, and of the
places they cross the
Though you’re used to using trigonometry to find missing angles and lengths in diagrams, the special shape of the graph of the sine and cosine functions make them very useful in modeling as well. Graphs that have a shape similar to that of a sine curve are called sinusoidal (even if they involve the cosine instead of the sine).
Come up with some situations in which a graph with the characteristics of a sine or cosine curve would provide a good model.
In general, sine and cosine curves are used to model situations that are periodic – that have some repeating pattern. (You might be familiar with this word from the periodic table, which is a chart of elements arranged so that, every time you begin a new row in the chart, the elements begin to repeat the same pattern of characteristics that was established in the previous row.) Sine and cosine functions are examples of periodic functions, and the distance you need to go on the $x$-axis before the values of the functions begin to repeat themselves is called the period.
What is the period of the sine function? How about the period of the cosine?
If you are using radians, what is the period of each function?
Not all situations that are periodic will have the same period. Nor will all be the usual sine or cosine graphs. For example, one situation that lends itself well to trigonometric modeling is the depth of a lake at a fixed location, measured over time as the tide comes in and out. Here is a graph of some data for a particular lake. $D \left ( x \right )$ measures the depth of the water in inches at time $x$ hours after midnight.
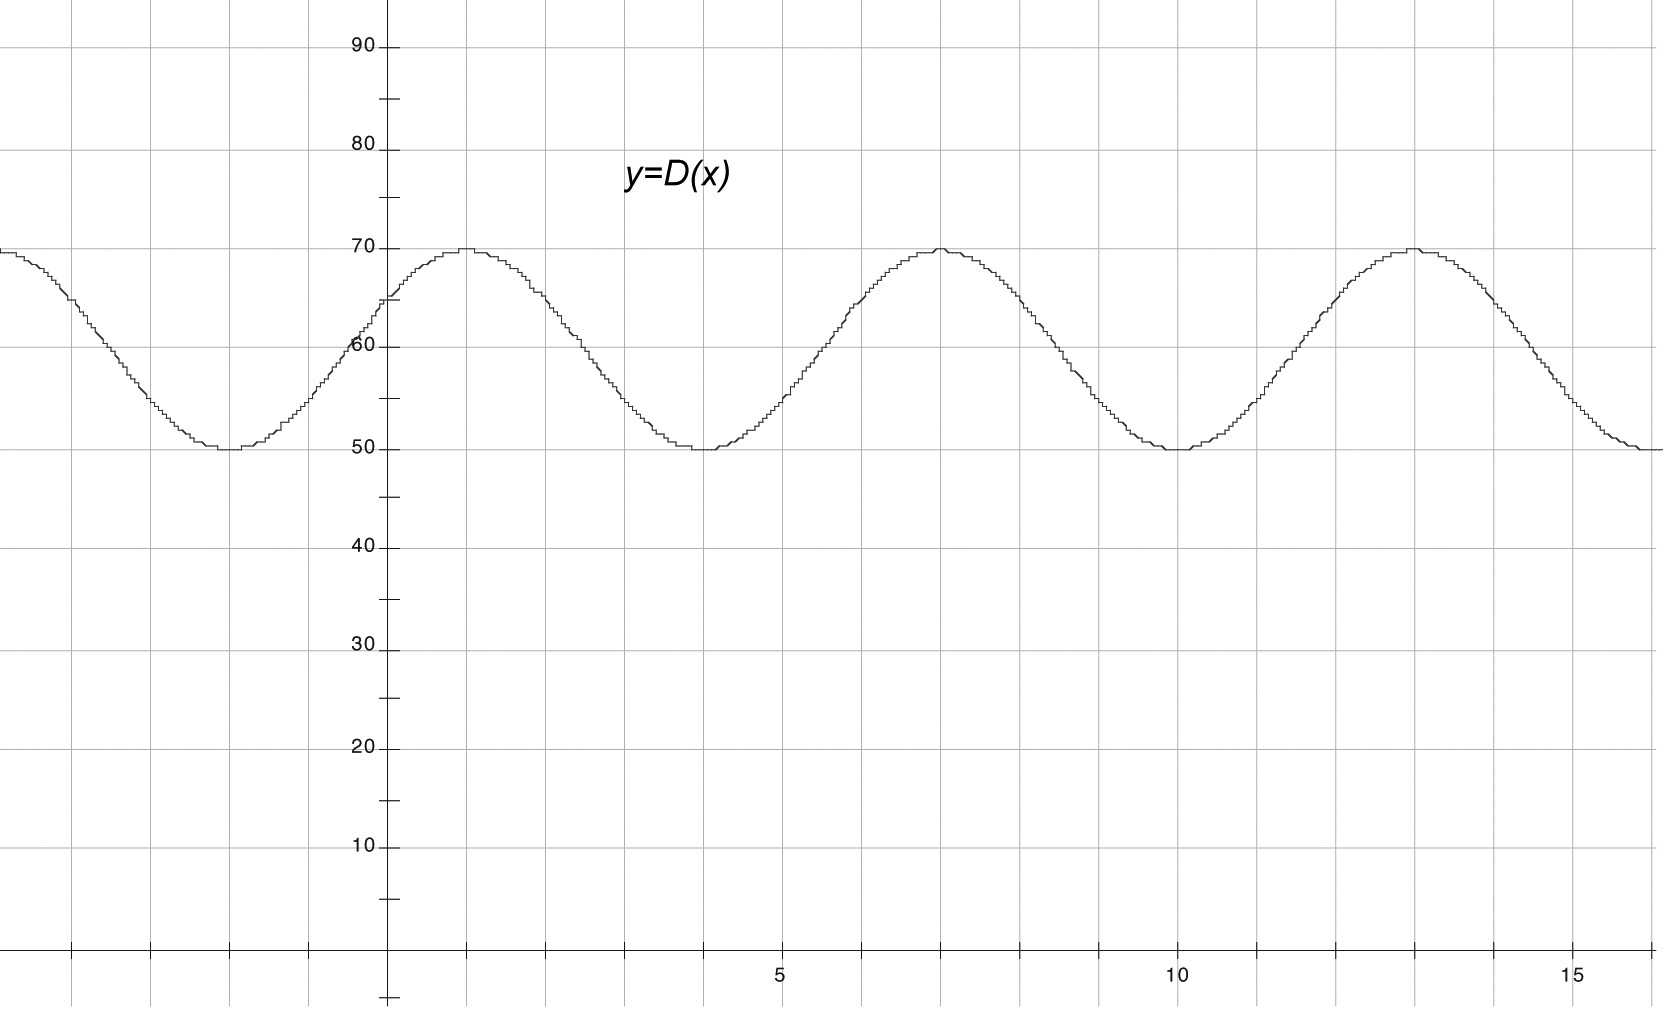
Though the shape of $D(x)$ is similar to that of a sine or cosine curve, clearly its equation is not $y = \sin x$ or $y = \cos x$. However, we can get the equation for this graph by doing various transformations of sine and cosine curves, much like we can take the graph of $y = {x^2}$ and use transformations to turn it into any parabola we choose. In order to figure out how to take a curve like $y = \sin x$ or $y = \cos x$ and turn it into the curve above, we’ll take things apart by looking at each of the transformations separately.
Development
Let’s first think about how we could change the period of a sine or cosine curve.
What type of transformation would changing the period be — a vertical stretch, vertical shift, horizontal stretch, or horizontal shift?
Suppose we wanted to cut the period of the sine function in half — make it $180^\circ$ instead of $360^\circ$. In other words, the sine function starts to repeat itself after $360^\circ$, but we want to find a different function that repeats itself after $180^\circ$. And put a third way (!) a partial table of values for the sine function looks like this …
|
$x$ |
$30^\circ$ |
$60^\circ$ |
$90^\circ$ |
$120^\circ$ |
$150^\circ$ |
$180^\circ$ |
$210^\circ$ |
|
$\sin x$ |
$\frac{1}{2}$ |
$\frac{\sqrt{3}}{2}$ |
1 |
$\frac{\sqrt{3}}{2}$ |
$\frac{1}{2}$ |
0 |
$-\frac{1}{2}$ |
…but for our new function the table of values should look like this, taking on all the same values but twice as quickly.
| $x$ |
$15^\circ$ |
$30^\circ$ |
$45^\circ$ |
$60^\circ$ |
$75^\circ$ |
$90^\circ$ |
$105^\circ$ |
|
The new function’s values |
$\frac{1}{2}$ |
$\frac{\sqrt{3}}{2}$ |
1 |
$\frac{\sqrt{3}}{2}$ |
$\frac{1}{2}$ |
0 |
$-\frac{1}{2}$ |
Come up with a function that looks like $y = \sin x$ but has half the period. If necessary, try a few formulas and test your conjectures.
Now try to find a formula for a function like the one above, except it has a period of $90^\circ$. Now find one with a period of $720^\circ$.
In terms of $n$, what is the period of the function $y = \sin nx$?
Write an equation for a function related to the sine function that has period P.
Does your idea work for cosine as well? Why or why not?
See if you can write an equation for a function that has the same period as the function in the tide example. You could pick either sine or cosine… for consistency, let’s use cosine.
In addition to the change in period, the tide function differs from the sine and cosine functions in other ways. For one thing, it is vertically stretched as compared to those functions.
What is the height of the usual cosine function, $y = \cos x$, measured from the $x$-axis to its highest point?
How many times its normal height do you need to stretch a cosine curve in order to get the same height as the curve for the depth of water function, $D(x)$?
Conjecture an equation for a cosine-based function that would be vertically stretched by the right amount. If you’ve done it right and also changed the period, the graph of your function should be exactly the same shape as $D(x)$.
The amplitude of a sine or cosine curve is defined as half the vertical distance from the top to the bottom of the curve. This was the quantity you found in Problem 12.
Why do you suppose the amplitude is defined as half the distance, rather than the entire distance from top to bottom?
What’s the amplitude of $f(x) = \sin x$? What’s the amplitude of $D(x)$ ?
Write an equation for a sinusoid curve that has amplitude A.
At this point, our graph has the right shape; we just need to translate it over to the right location. This is something you learned how to do when studying quadratics, though if you’ve forgotten, try experimenting with your calculator when answering the next few questions.
By how much do we need to vertically shift the graph?
Write an equation for a graph with the same period, amplitude, and vertical shift as $D(x)$ (again using cosine).
We could make this graph coincide perfectly with $D(x)$ by shifting it horizontally.
To remind yourself how to do a horizontal shift, first try writing equations that shift the graph of $y = {x^2}$ three units to the right, then three units to the left.
Now use the same technique to shift the graph of $y = \cos x$ by 90 degrees to the right, then 90 degrees to the left.
It’s not obvious how to do a horizontal shift at the same time that you change the period of a graph. First make a sketch of $y = \cos 90x$. Then write an equation that you could use to shift this graph two units to the right. Check by using your calculator to graph your equation, and refine your equation if necessary.
Determine the required horizontal shift needed to turn your graph in Problem 19 into the graph of $D(x)$.
Now that you have all the tools, write an equation for $D(x)$.
Having this model allows us to make predictions. For example ...
Use your equation for $D(x)$ to predict the depth of
the water at
Find all of the times today that the water will have a depth of 65 inches.
Algebraically — by solving an equation.
Graphically — by using your calculator.
Practice
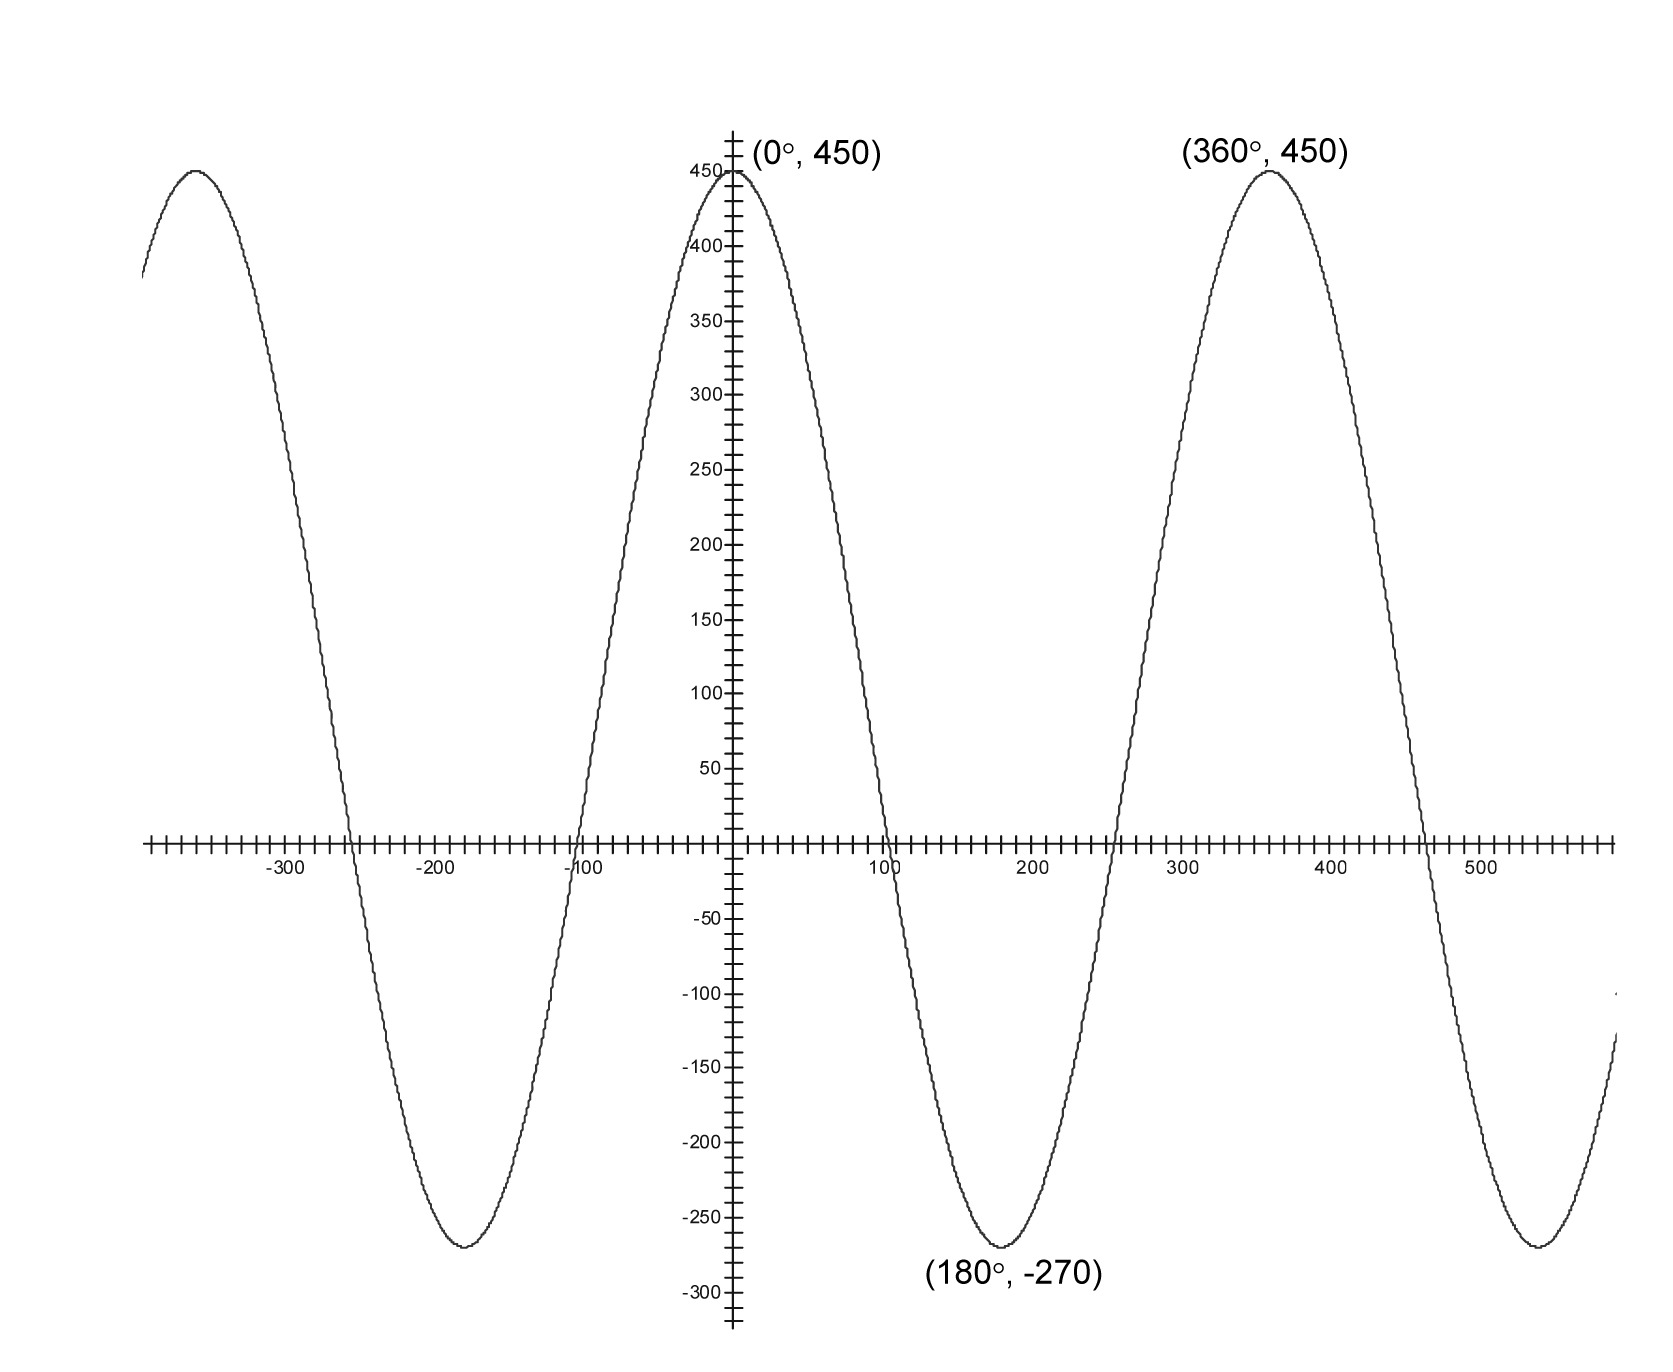
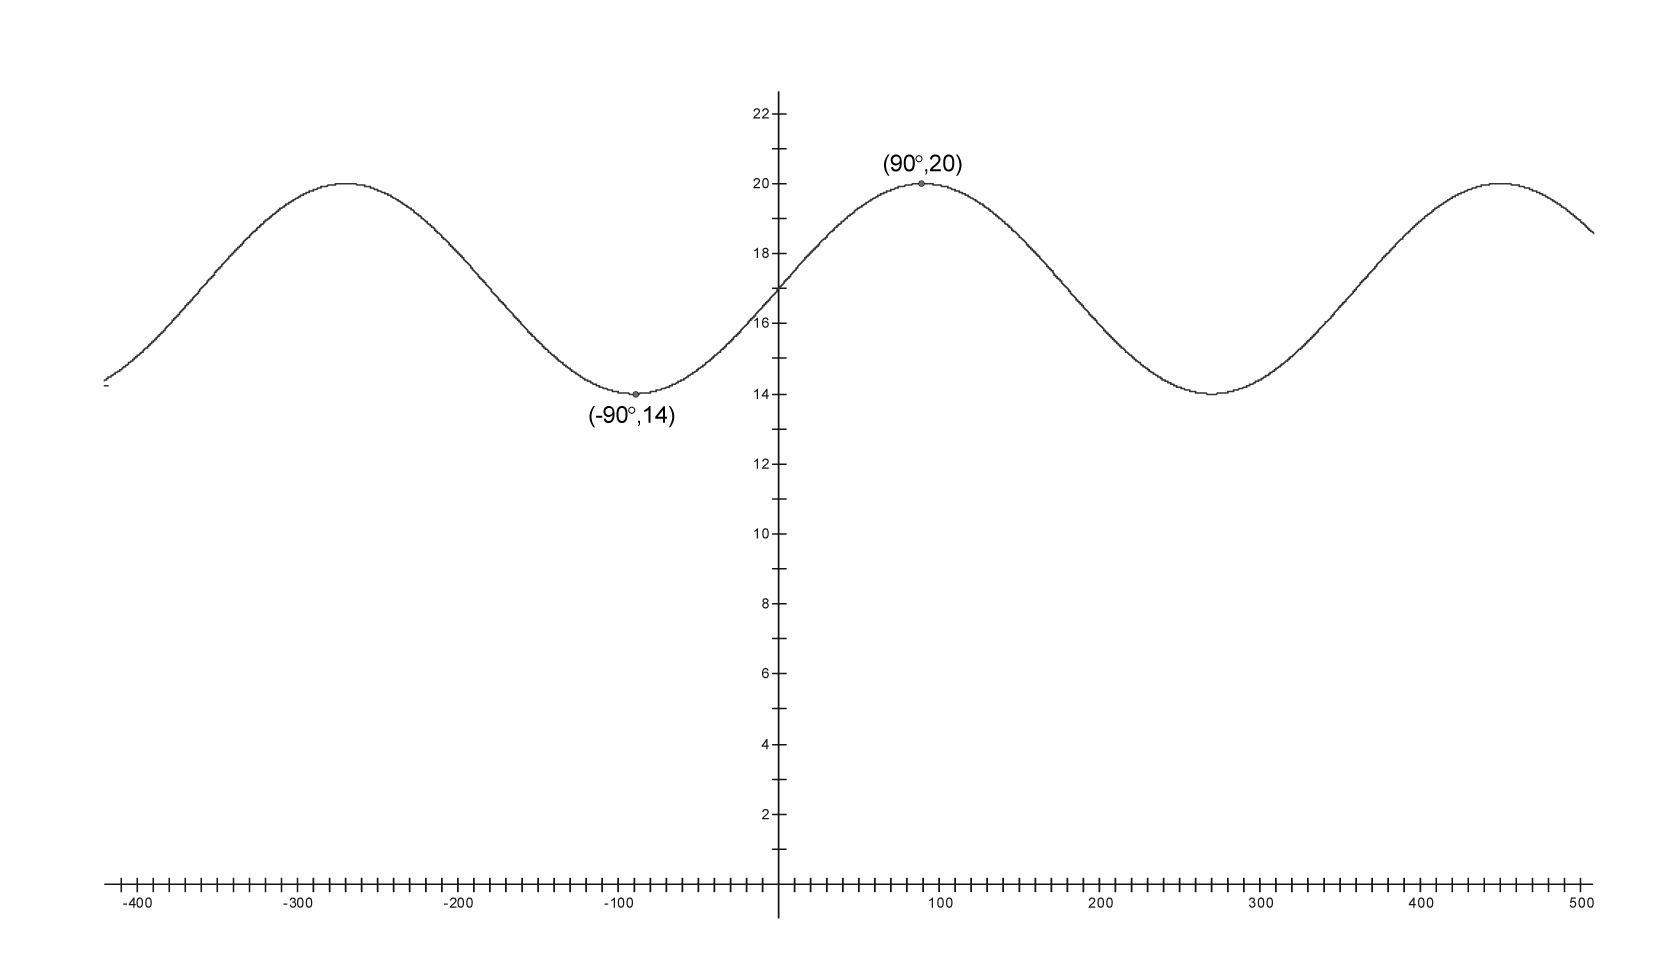
For each graph below,
say what the period, amplitude, vertical shift, and horizontal shift is, assuming that the graph is a transformation of $y = \cos x$.
write an equation for the graph. Check it by graphing the equation on your calculator.
i.
ii.
iii.
iv.
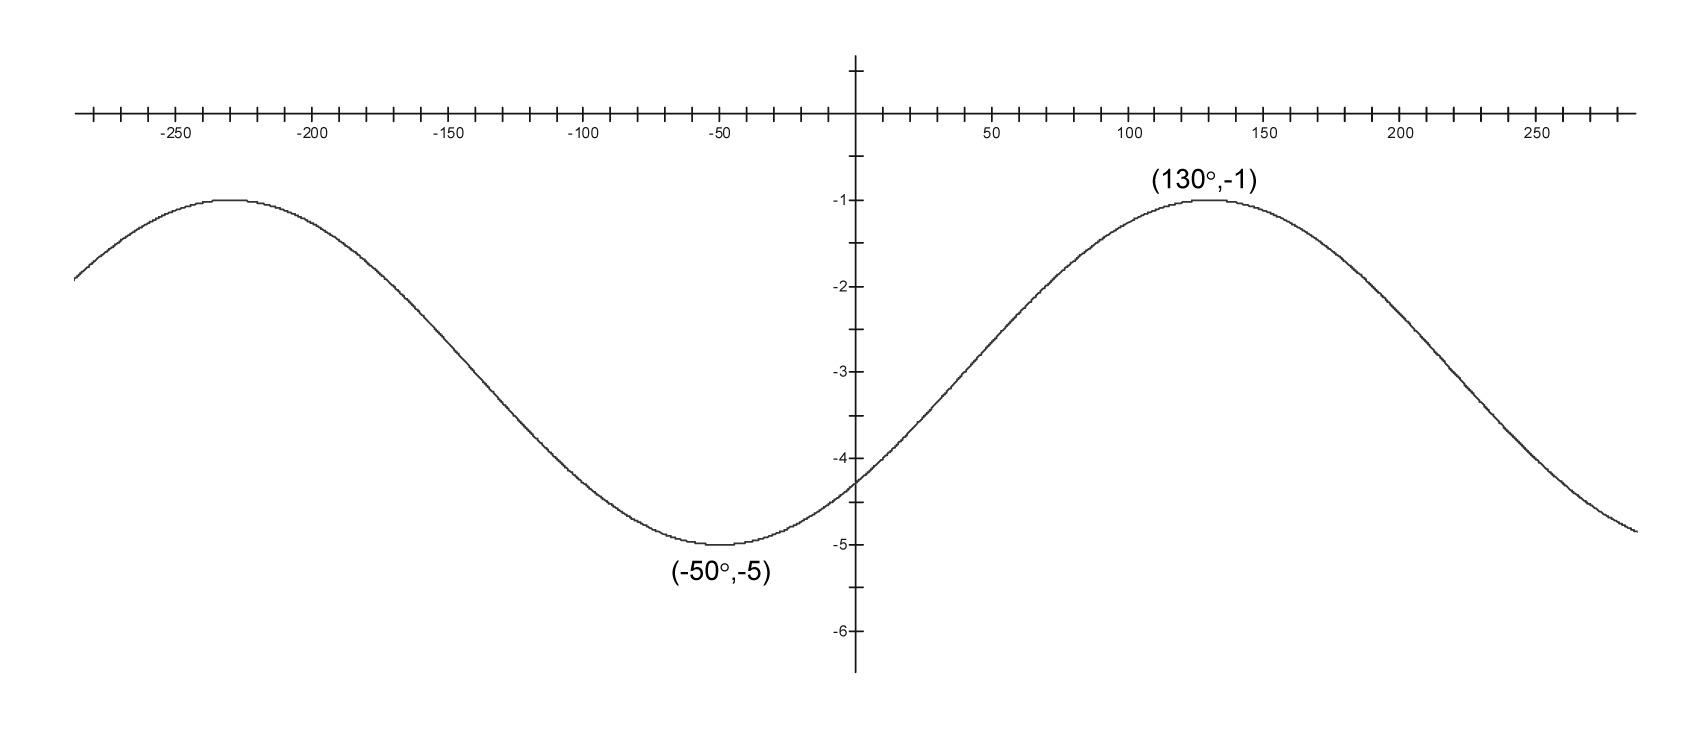
For each graph below,
say what the period, amplitude, vertical shift, and horizontal shift is, assuming that the graph is a transformation of $y = \sin x$.
write an equation for the graph. Check it by graphing the equation on your calculator.
i.
ii.
iii.
iv.
Find another equation for the function graphed in part i of the previous problem, this time using cosine instead of sine.
By identifying the period, amplitude, and shifts, draw a graph of each equation without the aid of your calculator (except to check).
$y = 2\sin x + 4$
$y = \dfrac {1} {2} \cos (2(x - 180))$
$y = \cos \left( {3\left( {x + 60} \right)} \right)$
$y = \sin \left( {3x + 60} \right)$
How would you describe to someone the difference between what you do to change the period and the amplitude of a trigonometric graph?
Find an equation for a sinusoidal function that has a peak at the point $(2, 9),$ and has its first trough following that peak at $(7, -3).$
Write a sinusoidal equation that has each of the following characteristics:
Period 36, amplitude .5, horizontal shift 5, vertical shift -7.
Period 6, amplitude 3, has a high point at $\left( {7,10} \right)$.
Zinadine argues that in the function $D\left( x \right)$ the vertical shift should really be 69, because the high point of an untransformed cosine graph is 1 unit above the $x$-axis, but the high point of $D\left( x \right)$ is 70 units above the $x$-axis. Set him straight.
Problems
Note to the eager student: though most references to angles in this section use degree measure, feel free to solve the modeling problems using radians. In fact, your teacher may insist!
Write an equation for a function involving sine or cosine that has a period of 40 degrees.
Write an equation for a function involving sine or cosine that has a period of 91 degrees.
Write an equation for a function involving sine or cosine that has a period of $4\pi $ radians.
What would be the period — measured in radians — of the function $y = \sin \dfrac{{2\pi }}{3}x$?
Which of these equations shifts the graph of $y = \sin x$ or $y = \cos x \; $ six units to the right? How do you know?
$y = 4\cos \left( {24\left( {x - 6} \right)} \right) - 7$
$y = 2\sin \left( {3x - 6} \right) + 4$
Sketch the following transformations: first shift the graph of $y = \cos x \;$ 90 degrees to the right. Then horizontally compress the resulting graph towards the $y$-axis by a factor of two.
Write an equation for the resulting graph.
Can you “see” from the equation that there was a shift of 90 degrees?
Describe the transformations that must be done on $y = \sin x$ in order to get the graphs of $y = \sin \left( {Ax - B} \right)$ and $y = \sin \left (A\left( {x - B} \right) \right)$. To what extent does order matter?
Graph the following equations:
$y = \sin \left( {10x - 60} \right)$
$y = \cos \left( {4x + 128} \right)$
Don’t use a calculator for this problem.
Solve: $\dfrac{9}{{x + 5}} = x - 5$
Evaluate: $\log 50 + \log 4 - \log 2$
Simplify $\sqrt {\dfrac{{{y^3}}}{{{x^2}}}} $
Solve the equation ${x^3}\left( {x - 1} \right){\left( {x - 2} \right)^2} = 0.$ What is the degree of this equation?
Find $k$ if $2^{2015}-2^{2014} + 2^{2013} - 2^{2012} = k \cdot 2^{2012}$
You are at the Inner Harbor on June 22. At 11:30 am, low tide, you find that the depth of the water at the end of a pier is 0.5 ft. At 5 pm, high tide, the water is 1.1 ft deep.
Find an equation for depth as a function of time that has elapsed since 12 midnight at the beginning of June 22.
Use your equation to predict the depth of the water at 8 pm on June 23.
At what time does the first low tide occur on June 23?
What is the earliest time on June 24 that the water will be 0.85 ft deep?
In August, in Baltimore, the temperature can be modeled by the equation $y = - 11\cos \left( {\frac{\pi }{{12}}\left( {x - 2} \right)} \right) + 74$, where $x$ stands for the number of hours past midnight on Aug. 1, and $y$ stands for the temperature (in Fahrenheit) at time $x$.
Use algebra to find all times at which the equation predicts that the temperature will be more than 80°.
What does this equation imply that the maximum temperature will be? Explain your reasoning carefully. (And don’t appeal to your graphing calculator)
A spring is attached to the ceiling of a room. You attach a weight to the bottom of the spring, then let go. Some time later, you start timing the oscillations of the spring. 0.4 seconds after you start the time, the spring stretches as far as it will go, to a distance of 24 inches above the floor. It then bounces back up, to a highest point of 50 inches above the floor, at 2 seconds, and continues to oscillate sinusoidally.
Sketch the graph of this function.
Find an equation for distance from the floor as a function of time.
What was the distance of the weight from the floor when you started the clock?
What is the distance of the weight from the floor after 4 seconds?
When does the weight first reach a height of 40 inches?
At time zero, someone puts a chalk mark at the top of your unicycle tire, and you immediately begin pedaling in such a way that the wheel makes two complete revolutions per second. The radius of your wheel is 1 foot.
Write an equation giving the height (measured from the ground) of the chalk mark as a function of time since you began pedaling. Be sure to show your work in finding the equation.
Use the equation to find the height of the chalk mark 2.3 seconds after you began pedaling.
Use the equation to find two times at which the chalk mark will be .8 feet above the ground. Then describe all the times at which the chalk mark will be .8 feet above the ground.
What might the graph of $y = - \sin x$ plausibly look like? Without using your calculator, check a few values in your head.
Try graphing $y = - \sin x$ on your calculator. Then try graphing $y = \sin \left( { - x} \right).$ Describe how these graphs differ from the graph of $y = \sin x$ using the language of transformations.
Use the results of the previous problem to predict what the graphs of $y = - \cos x$ and $y = \cos \left( { - x} \right)$ will look like. Then test your prediction by graphing them on your calculator. Describe how these graphs differ from the graph of $y = \cos x$ using the language of transformations.
Make a table of values for the function $y = {\sin ^{ - 1}}x$. Then graph it, taking care to choose a scale appropriate for your values for $x$ and $y$ in the table. Does it appear to be visually related to the graph of $y = \sin x$ in any way?
(Hint: visualize!) Make up a sinusoidal function $f\left( x \right)$ that has exactly four solutions to the equation $f\left( x \right) = \frac {1} {2}$ between $0^\circ$ and $360^\circ$. Then make one up that also has four solutions to $f\left( x \right) = \frac {1} {2}$ but also two solutions to $f\left( x \right) = 5$ between $0^\circ$ and $360^\circ$.
Go back to the function $D\left( x \right)$, for which you should have found the equation $D\left( x \right) = 10\cos \left( {60\left( {x - 1} \right)} \right) + 60$. Recall that $x$, the time, is measured in hours and $D\left ( x \right )$, the depth of the water, is measured in inches.
Approximately how many feet per hour was the water level changing at 6 am?
How about at 3 am? Explain the sign of your answer.
At what times during the day would you expect the rate of change to be greatest? How about the smallest?
Let $f \left ( x \right ) = 2 \sin x$ and $g \left ( x \right ) = 8 \sin x$.
Is there an $x$-value at which the slope of $g$ will be four times greater than the slope of $f$ ? Test your conjecture.
Why is it plausible that the slope of $g$ would always be four times greater than the slope of $f$ ?
The website
http://ptaff.ca/soleil/?lang=en_CA
creates a
“daylight hour graph” for major world cities.
Make one for Baltimore on today’s date. Then, using $x$ to represent days of the year and $y$ to represent the number of hours of daylight on that day, write an equation to match the graph you see.
Imagine what the daylight hour graph for Vancouver would look like. Would you expect it to be different from the Baltimore graph in any of the following respects: period, amplitude, horizontal shift, vertical shift? Then create a graph for Vancouver and see if you are right.
Here is a table showing the number of daylight hours on the first of each month in the cities of Juneau and Fairbanks, Alaska. (Data from http://www.absak.com/library/average-annual-insolation-alaska)
|
City |
Jan |
Feb |
Mar |
Apr |
May |
June |
|
Juneau |
6:30 |
8:15 |
10:34 |
13:13 |
15:43 |
17:48 |
|
Fairbanks |
4:00 |
6:55 |
10:07 |
13:35 |
17:01 |
20:33 |
|
July |
Aug |
Sept |
Oct |
Nov |
Dec |
|
|
Juneau |
18:10 |
16:30 |
14:01 |
11:30 |
8:55 |
6:53 |
|
Fairbanks |
21:25 |
18:11 |
14:39 |
11:19 |
7:51 |
4:43 |
Write equations for the hours of daylight in both Juneau and Fairbanks. Use month of the year for $x$. Note that the numbers in the table are given in “hours:minutes” form, so you’ll have to decide how to convert them to decimal notation.
According to the equation/graph you’ve made, what is the day of the year that receives the least daylight? Does this seem right? What data would you need in order to make a more accurate graph?
Graph the two equations on your calculator in order to estimate when Juneau and Fairbanks have the same number of hours of daylight. What time of year is this?
Critics of the theory of global warming say that changes
in the Earth’s temperature are cyclic. The graph below shows
the level of CO2 in the atmosphere (which directly affects
temperature).
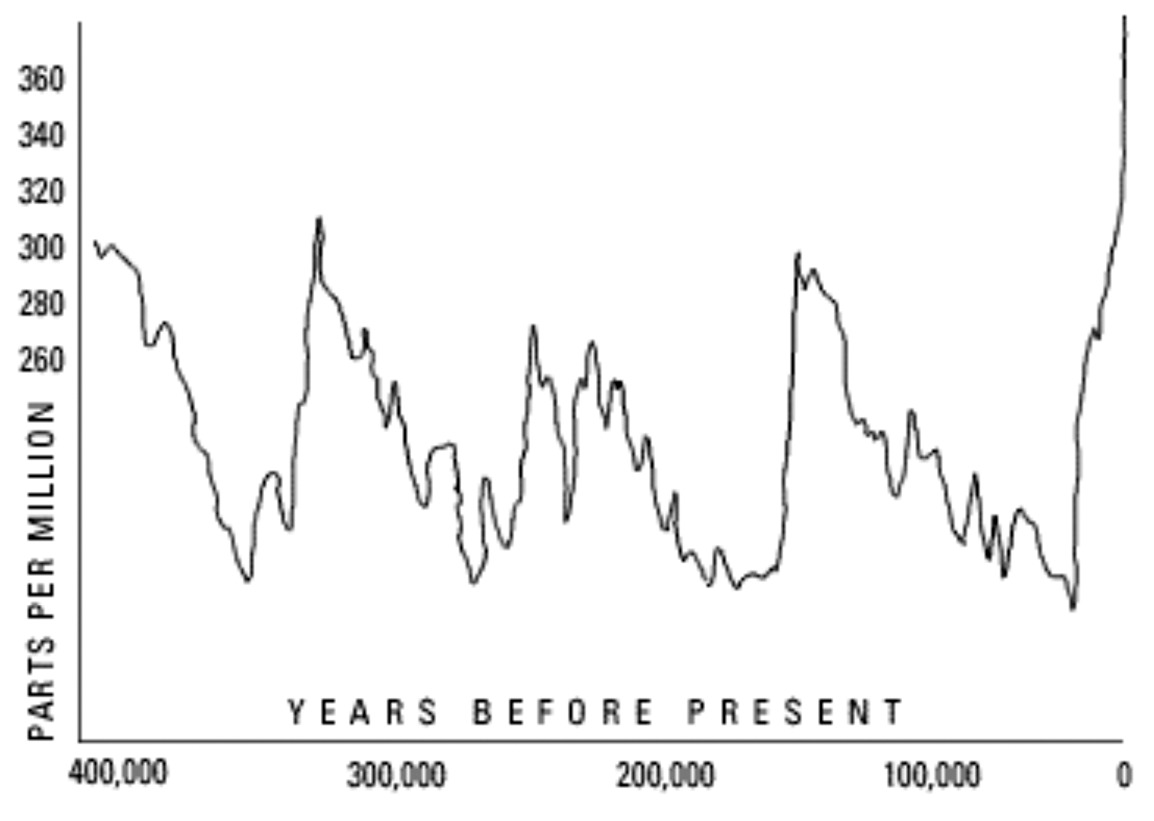
image from http://www.pbs.org/wgbh/warming/etc/graphs.html
Approximate some data points, and use these to come up with an equation giving the CO2 level vs. year.
Use this equation to predict what the CO2 levels should be in the early 21st century, and compare your answer with the graph.
Exploring in Depth
(from Foerster’s $Precaclulus$) The hum you hear on some radios when they are not tuned to a station is a sound wave of 60 cycles per second.
Is the 60 cycles per second the period, or is it the frequency? If it is the period, find the frequency. If it is the frequency, find the period.
The wavelength of a sound wave is defined as the distance the wave travels in a time equal to one period. If sound travels at 1100 ft/sec, find the wavelength of the 60-cycle-per-second hum.
The lowest musical note the human ear can hear is about 16 cycles per second. In order to play such a note, the pipe on an organ must be exactly half as long as the wavelength. What length of organ pipe would be needed to generate a 16-cycle-per-second note?
Make the following graph: put radian measure on the $x$-axis. On the $y$-axis, plot the value for the slope of $y = \sin x$. Plot enough points to get a general sense of the curve, then find an equation for it.
Repeat the previous question, this time plotting the slope of $y = \cos x$. Find an equation for this graph as well.