Introduction
The following data, taken from facebook.com, describe the approximate number of Facebook users at various times since the beginning of 2004.
|
$t$ |
$P$ |
|
12 |
1 |
|
24 |
5.5 |
|
36 |
12 |
|
46 |
50 |
|
56 |
100 |
|
61 |
150 |
|
62 |
175 |
|
64 |
200 |
|
67 |
250 |
|
69 |
300 |
Use your calculator to plot these data, with the Facebook population on the $y$-axis, and time in months on the $x$-axis. Then, try to predict how many people were on Facebook at the beginning of 2010.
Looking at the data, it’s quite clear that the Facebook population has been growing over time, and it’s also pretty easy to see that the $rate$ at which it’s growing is increasing, too. Even if we take those two observations into account, though, there seems to be quite a wide range of plausible predictions in problem 1. It’s hard to know how to decide whether, say, 375 million users or 500 million users is the better prediction.
What if we could find an equation that appeared to fit the existing data very well? In that case, we would have reason to believe that the equation was a good mathematical model for Facebook population growth, and we could therefore make more specific, confident predictions.
If you’ve studied biology, you might have seen that exponential models are one of the simplest and most common types of models used for population growth. Even though Facebook isn’t quite same as, say, bacteria in a Petri dish, it turns out that these data indeed appear to exhibit exponential growth. Let’s find an exponential function that fits the data. Recall that, by definition, an exponential function has an equation in the form $y = a \cdot {b^x}$, where $a$ and $b$ are constants.
To find constants for our data, we’ll need to substitute two points into the general exponential equation, and then solve the resulting pair of equations for $a$ and $b$.
We have more points than we need:
since there are only two constants to solve for, we actually
only need two points. Which of the following pairs of points
do you think we should use to get the best fit for the whole
data set? Why?
$\left( {12,1} \right)$ and $\left( {24,5.5} \right)$
$\left( {24,5.5} \right)$ and $\left( {64,200}
\right)$
$\left( {36,12} \right)$ and $\left( {62,175}
\right)$
For each of the pairs of points in part a, find the equation of an exponential function that goes through the two points. Then, use your calculator to graph each of these three equations together with the actual data. Which one was the best fit? Which was worst? Why?
Using whichever equation from problem 2 fit the data best, predict the Facebook population at the beginning of 2010. Compare your predictions to the actual data, available at: http://www.facebook.com/press/info.php?timeline.
Development
Jenn Jeffings, ecologist extraordinaire, has taken some data, shown below, on chestnut oak trees in the woods around her house. She used the house as home base, and counted the number of chestnut oaks within certain distances. So, for example, the second row in the table indicates that Jenn counted 63 chestnut oaks that were each no more than 10 meters away from the house. Plot these data using your calculator.
|
Distance (meters) |
Number of chestnut oaks |
|
5 |
16 |
|
10 |
63 |
|
12 |
90 |
|
15 |
141 |
|
20 |
251 |
|
24 |
362 |
You can see clearly that, just as with the Facebook data,
the $y$ values are increasing
at a faster and faster rate.
Are the data exponential? Either use an equation and some algebra, or else work directly with the numbers to answer this question.
It turns out that Jenn’s tree data can be modeled accurately using a power function, which is any function that can be described with an equation of the form $y = a \cdot {x^n}$, where $a$ and $n$ are constants.
Strategically pick two points and use them to solve for the constants $a$ and $n$. Check out the particular equation that results by graphing it on your calculator together with the data.
According to the model you made in problem 5, how many chestnut oaks are within 100 meters of Jenn’s house?
The equation you came up with in problem 5 is just one example of a power function. Let’s take a brief look at these functions in general.
Is the graph of $y = 5{x^2}$ exactly five times steeper than the graph of $y = {x^2}$ ? Is it exactly five times higher? Experiment with some values of $a$ other than 5, and see if you can get any different effects. In each case, it will be helpful to compare your graph to the more basic $y = {x^2}$.
Graph $y = {x^4}$ and $y = {x^5}$ on your calculator. Compare them to $y = {x^2}$ and $y = {x^3}$. Now predict what $y = {x^{94}}$ and $y = {x^{95}}$ will look like. Check your prediction. What can you say in general about power functions where $n$ is a positive integer?
Find the coordinates of a specific point that must be on the graph of $y = 3{x^n}$, regardless of the value of $n$. Then find one more.
Let’s go back to the Facebook data we looked at in the introduction. In problem 2, you should have seen that the equation $P = 0.637 \cdot {1.094^t}$ fit the data best. For consistency, let’s use that equation for the following problems.
Suppose you were writing a Postscript article about Facebook’s incredible exponential growth, and you wanted to include a prediction about when we would expect the Facebook population to reach 1 billion users. According to the equation, when will this happen?
According to the equation, how long will it be after your answer to the previous problem until the population reaches 2 billion users? And how long after that until it hits 4 billion users?
Write an equation that expresses the time $t$, as a function of the population $P$. In other words, rewrite the equation $P = 0.637 \cdot {1.094^t}$ in “$t = $ ” form.
On the one hand, you could think of this equation as being the same as, or equivalent to, the original “$P = $ ” equation. On the other hand, though, it’s quite clear that in this equation, the “input” and “output” variables have been reversed. As you might recall from the lesson on algorithms, this means that the equation you wrote in problem 12 represents the inverse of the original function. (Actually, they are inverses of each other.)
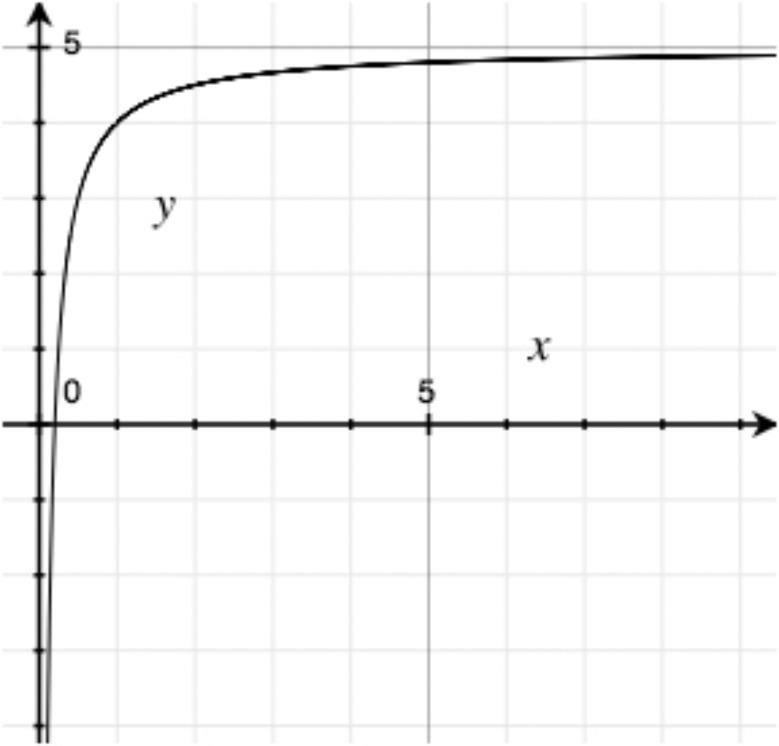
Equations of the form $y = a{\log _b}\left( x \right) + c$ are called logarithmic functions. If you haven’t already, use a bit of algebra to show that the equation you wrote in problem 12 is, indeed, a logarithmic function. Why does it make sense that the inverse of an exponential function would be a logarithmic function?
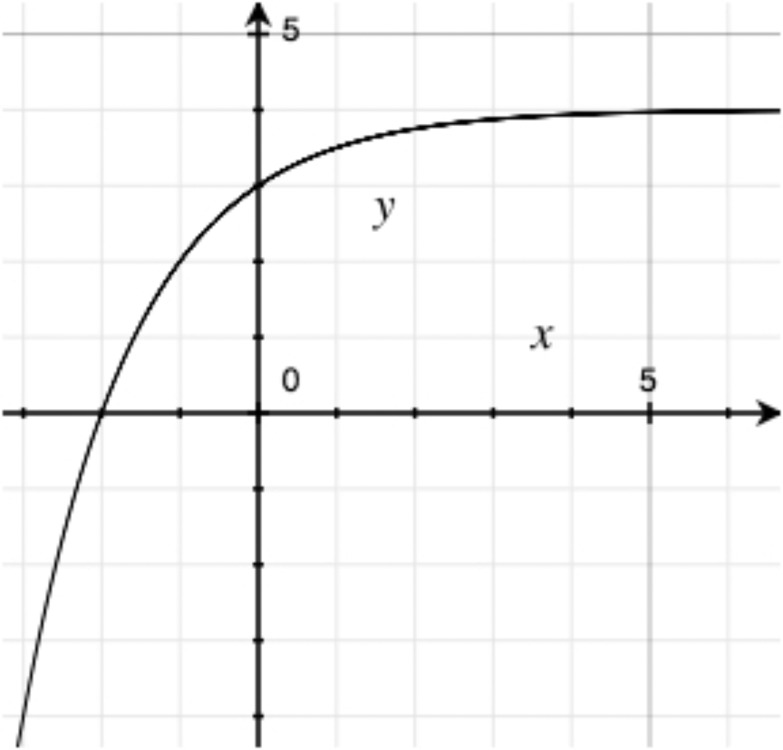
Below is a graph of the equation $P = 0.637 \cdot {1.094^t}$ .
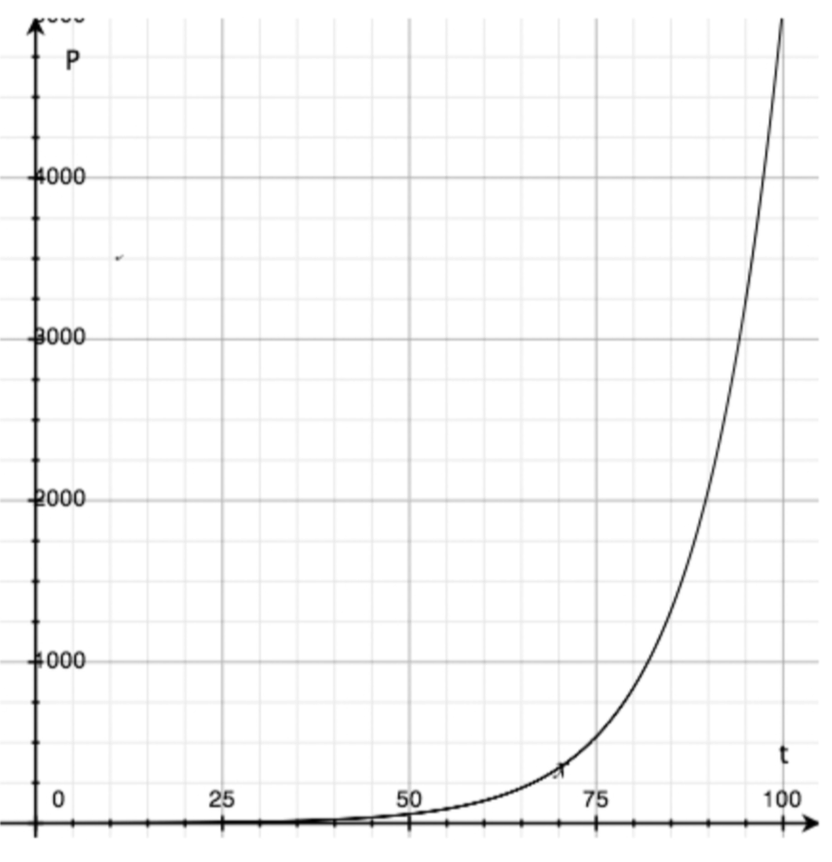
Using the graph above, and without using your calculator, make a large (at least half-page) and accurate graph of your equation from problem 12. (Remember that, typically, we put the output on the vertical axis and the input on the horizontal axis.) What do you notice about the graph?
Plot your answers to problems 10 and 11 both on the graph above and also on your graph.
Practice
Fit a power function to each set of data.
|
$x$ |
2 |
3 |
5 |
10 |
14 |
|
$y$ |
24 |
81 |
375 |
3000 |
8232 |
|
$x$ |
4 |
9 |
11 |
17 |
22 |
|
$y$ |
52.8 |
139.7 |
177.7 |
299.6 |
408.2 |
|
$x$ |
10 |
20 |
30 |
40 |
50 |
|
$y$ |
3.2 |
17.9 |
49.3 |
101.2 |
176.8 |
Fit a logarithmic function to the following data.
|
$x$ |
1 |
10 |
50 |
100 |
1000 |
|
$y$ |
4 |
5.5 |
6.5 |
7 |
8.5 |
Find the inverse of each of the following functions.
$H = 3t + 5$
$V = \dfrac {4} {3} \pi r^3$
$K = 65 + 30 \cdot {0.8^t}$
$T = {\log _2} n + 2$
Problems
In each of the following datasets, it appears that $y$ increases at a faster and faster rate as $x$ increases. Which of them are exponential?
|
$x$ |
1 |
3.3 |
7.5 |
15 |
27.8 |
|
$y$ |
0.75 |
8.17 |
42.19 |
168.75 |
579.63 |
|
$x$ |
1 |
10 |
21 |
34 |
42 |
|
$y$ |
2 |
63.2 |
192.5 |
396.5 |
544.4 |
|
$x$ |
1 |
3 |
5 |
7 |
9 |
|
$y$ |
3.14 |
28.26 |
78.5 |
153.86 |
254.34 |
When a rock is dropped from the top of a large cliff, it falls to the Earth in a very predictable way. Assuming air resistance is negligible (for the first few seconds at least, not a ridiculous assumption), here is a chart of time vs. distance fallen in the previous second. For example, at $t = 3$ seconds, the rock fell 80 feet in the previous second.
|
Time (secs) |
Distance this second (feet) |
Total Distance (feet) |
|
1 |
16 |
|
|
2 |
48 |
|
|
3 |
80 |
|
|
4 |
112 |
|
|
5 |
144 |
|
|
6 |
176 |
Can you write an equation that relates total distance fallen (i.e. distance fallen from the top of the cliff) to time elapsed?
Suppose that you had the following data on the number of downloads $D$ of Lady Gaga’s latest single, as a function of time $t$ in days since it came out.
|
$t$ (days) |
$D$ (millions of downloads) |
|
10 |
42 |
|
15 |
60 |
|
50 |
300 |
Fit an exponential function to the data provided, and use your equation to predict the number of downloads on the 100th day after release.
Now, fit a power function to the data, and use that equation to predict $D(100 \ {\rm{ days}})$.
How much confidence do you have in each of these models? Explain.
Graph $y = {\left( {{\raise0.5ex\hbox{$\scriptstyle 3$} \kern-0.1em/\kern-0.15em \lower0.25ex\hbox{$\scriptstyle 5$}}} \right)^x}$ in the standard window on your calculator. It appears that this graph eventually touches the $x$-axis. Estimate at what value of $x$ this happens.
In the previous problem, you probably saw that as $x$ gets larger and larger, the graph of $y = (\frac{3}{5})^x$ and the $x$-axis become nearly indistinguishable. When this happens, we say that the graph of $y = (\frac{3}{5})^x$ and the $x$-axis are asymptotic to each other. We can also say that the $x$-axis is an asymptote of the graph of $y = (\frac{3}{5})^x$ .
Is the graph of every equation of the form $y = {b^x}$ asymptotic to the $x$-axis? Explain.
The $x$-axis is a horizontal asymptote of $y = (\frac{3}{5})^x$ . What vertical line is the graph of $y = (\frac{3}{5})^x$ asymptotic to?
It’s hard to experience it without going into space, but it turns out that your weight actually depends on how far you are from the center of the earth. Here are some data showing how an individual’s weight would vary:
|
Distance (miles) |
Weight (pounds) |
|
10000 |
18.9035532 |
|
20000 |
4.7258883 |
|
40000 |
1.181472075 |
|
80000 |
0.295368019 |
These data can actually be modeled by a power function. Using that fact, and the definition of a power function, find an equation for the data.
According to your equation, how would your weight change if you doubled your present distance away from the center of the earth? (Note: the radius of Earth is about 3969 miles… but does that even matter?)
How far up would you have to go in order for your weight to be 1% of what it is on the Earth’s surface?
Graph the equation you found in part a. Does it have any asymptotes? If so, what do they mean in terms of the situation being modeled?
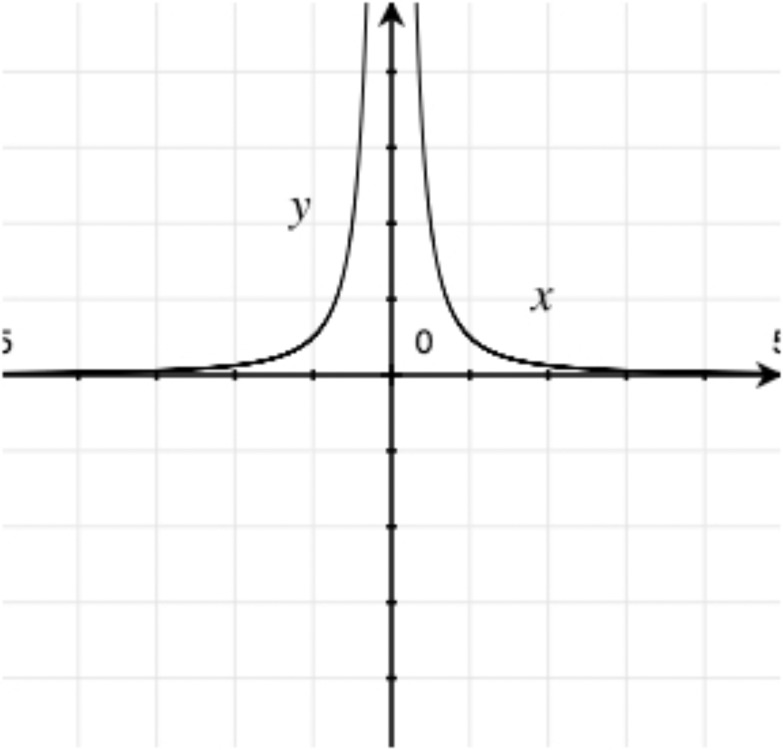
The equation you found in the previous problem is an example of an inverse power function — that is, a function of the form $y = a{x^n}$, where $n$ is negative. Experiment with a few different values of $a$ and $n$ to get a sense for what inverse power functions can look like. Is it true that every inverse power function is asymptotic to both axes? Why?
The following data show the number of hours of sunlight in northern Maine based on the number of days since the winter solstice, which in 2009 was on December 21. (So, for example, the first row shows the number of hours of sunlight on December 21, the shortest day of the year.)
|
Sunlight hours |
Days after winter solstice |
|
8.5 |
0 |
|
8.6 |
7 |
|
8.7 |
14 |
|
8.9 |
21 |
|
9.2 |
28 |
|
9.5 |
35 |
(data from
http://astro.unl.edu/classaction/animations/coordsmotion/daylighthoursexplorer.html)
One night, at their vacation home in Maine, Brad Pitt and Angelina Jolie had a fight. Brad couldn’t sleep that night, and so he was up when the sun rose at 7:04am. By the time it set at 4:22pm, they still hadn’t made up. Using the data in the table, is it possible to say which day of the year Brangelina had their fight?
Often, when we are trying to model a phenomenon using mathematics, we’re interested in using one variable, called the input, to predict the value of another variable, the output. This is generally only possible, however, if the input uniquely determines the output — or, in other words, when there is at most one output for any given input. When this is the case, we say that the relationship is a function. This was true, for example, in the Facebook population example at the beginning of the lesson, but it was $not$ the case in problem 25. In each of the following, determine whether the given relationship is a function.

Output: average temperature in Baltimore city.
How many vertical asymptotes does the graph of $y = 2{x^5}$ have?
Does $y = \log x$ have any vertical or horizontal asymptotes? Explain.
Google and others roughly measure the popularity of a given website based on the number of other pages on the Internet that link to the site. The following dataset shows how many blogs there are at different levels of popularity. As you might expect, there are significantly more unpopular blogs than there are popular ones.
|
Popularity |
Number of Blogs |
|
5 |
50 |
|
10 |
40 |
|
16 |
30 |
|
35 |
20 |
|
132 |
10 |
|
530 |
4 |
|
4014 |
1 |
Find a power function that fits these data.
Based on your equation, how does the
number of blogs with 1000 people linking to them compare
with the number of blogs 500 people linking them?
Is the asymptotic nature of inverse power functions relevant to the situation being modeled? Explain.
According to this equation, how many links would the single most popular blog have?
Come up with a function whose graph is
asymptotic to the line $y = 3$. Can you make one that is
also asymptotic to the line $x = 5$ ?
In the chart below, there are four functions ($f$, $g$, $h$, and $j$) that are either “regular” power functions ($y=k{x^n}$, $n$ positive) or inverse power functions ($y=k{x^n}$, $n$ negative). For each function in the chart, determine which of these types of functions it is, and then find $k$ and $n$.
|
$x$ |
-4 |
-3 |
-2 |
-1 |
0 |
1 |
2 |
3 |
4 |
|
$f(x)$ |
-.0156 |
-.037 |
-.125 |
-1 |
--- |
1 |
.125 |
.037 |
.0156 |
|
$g(x)$ |
48 |
27 |
12 |
3 |
0 |
3 |
12 |
27 |
48 |
|
$h(x)$ |
5.2 |
3.9 |
2.6 |
1.3 |
0 |
-1.3 |
-2.6 |
-3.9 |
-5.2 |
|
$j(x)$ |
-.3125 |
-.5555 |
-1.25 |
-5 |
--- |
-5 |
-1.25 |
-.5555 |
-.3125 |
If you graphed the data and equations in the previous problem, you can clearly see four distinct shapes that a power function can have, depending on whether the power is even, odd, negative, or positive. The data below have yet another shape — and this data, too, can be modeled by a power function. Find an equation for the data. Does the graph of your equation have a horizontal asymptote?
|
$x$ |
1 | 8 | 27 | 36 | 43 |
|
$y$ |
5 | 10 | 15 | 16.5 | 17.5 |
The following data from the 2006 census shows the distribution of wealth in the United States. The second row, for example, says that there are 8,138,000 households having an income of $60-70 thousand dollars per year.
|
Income range |
Thousands of households |
|
10,000-20,000 |
14,447 |
|
60,000-70,000 |
8,138 |
|
110,000-120,000 |
2,920 |
|
160,000-170,000 |
992 |
|
210,000-220,000 |
336 |
|
240,000-250,000 |
245 |
(Data from: http://pubdb3.census.gov/macro/032006/hhinc/new06_000.htm.)
Based on what you know about the shapes of different functions, what types of functions could model these data? Does one type seem more promising?
Find an equation that accurately models the data above.
Using your equation, predict how many U.S. households have an income of $80,000.
Check out this visualization of the data above: http://www.visualizingeconomics.com/2006/11/05/2005-us-income-distribution/
The data you’ve seen in the previous problem, as well as in problem 29, are examples of what’s called the “80-20 rule,” or the “Pareto principle.” Vilfredo Pareto, an economist in the late 1800’s, made two oddly related observations: 80 percent of Italy’s wealth was owned by roughly 20 percent of the population, and 80 percent of the peas he harvested in his garden came from roughly 20 percent of the pea plants. (http://en.wikipedia.org/wiki/Pareto_principle.)
Since then, a surprising number of phenomena have been discovered to follow this general rule. Here’s another example.
The data set below comes from a study of how often different words appear in a large sample of English text. The first column represents a certain level of rarity or commonness for a word, and the second column shows how many words had appeared with that frequency. So, for example, there were 586 words that appeared around 200 times, whereas there were only 73 words that appeared 600 times.
|
Approximate word frequency |
Number of words with (approximately) this frequency |
Example words with this frequency |
|
200 |
586 |
“congress”, “traffic” |
|
300 |
236 |
“particularly”, “restaurant” |
|
400 |
147 |
“dinner”, “dollar” |
|
500 |
88 |
“question”, “lives” |
|
600 |
73 |
“sit”, “neat” |
(Data from: http://www.americannationalcorpus.org/frequency.html)
Is there evidence directly in the data above to suggest whether this situation would be modeled better with an exponential or a power function?
Find an equation that models the data above.
Use your equation to predict how many words would appear approximately 2010 times in the sample text.
You probably know that as you gain altitude, the temperature decreases. Here’s some data that provides detail on this phenomenon for a particular location.
|
Height above sea level (m) |
Temp (C) |
|
1000 |
8.5 |
|
2000 |
2 |
|
3000 |
-4.5 |
|
4000 |
-11 |
|
5000 |
-17.5 |
(Data from: http://www.usatoday.com/weather/wstdatmo.htm)
If you wanted to fit an equation to these data, what type of function do you think you should try first?
Find an equation for the data, and use it to predict the temperature at an altitude of 7 kilometers above sea level.
At 10:00 am Tim left his hot cup of tea on the table in his classroom. The air conditioning in the room was on, so the temperature of the tea dropped fairly quickly, as indicated in the table below. The time is in minutes after 10:00 am and the temperature is in °F.
|
Time |
Temperature |
|
0 |
170.5 |
|
5 |
130.5 |
|
10 |
106.5 |
|
15 |
92.1 |
|
20 |
83.46 |
|
25 |
78.28 |
|
30 |
75.17 |
|
35 |
73.3 |
|
40 |
72.18 |
Plot these data on a coordinate axis system. To what temperature does the tea’s temperature appear to be converging?
According to Newton’s Law of Cooling, the temperature should be an exponential function of time. Try to fit an exponential equation to the data above. What happens? Why?
Find an equation that accurately models the given data. Based on your equation, predict the time at which Tim’s tea will be within 1 degree of room temperature.
Sketch a graph of the equation you came up with in the previous problem. Now, estimate the slope of this curve at four different points.
What are the units of your slope values? What do these numbers mean about Tim’s cup of tea?
Newton’s Law of Cooling is actually stated thus: the rate of heat loss of an object is directly proportional to the difference between the object’s temperature and room temperature. Do some calculations to verify this, using your answers to part a.
Suppose that the following data shows the height of a soccer ball as a function of time. As you probably learned in physics, these data should be parabolic, and therefore can be modeled using a quadratic equation.
|
Time(s) |
Height(m) |
|
0 |
0 |
|
0.5 |
11 |
|
1 |
19 |
|
1.5 |
25 |
|
2 |
28 |
|
2.5 |
29 |
|
3 |
27 |
|
3.5 |
23 |
|
4 |
17 |
Find an equation that accurately models the data.
Mick Jagger, who was watching the game, took a picture on his cell phone when the ball was 22 meters above the field. How many seconds after the ball was kicked did Mick take the photo?
Is it possible to write a single equation that gives you $t$ as a function of $h$?
For each of the relationships in problem 26 that you decided was a function, determine whether or not it has an inverse function.
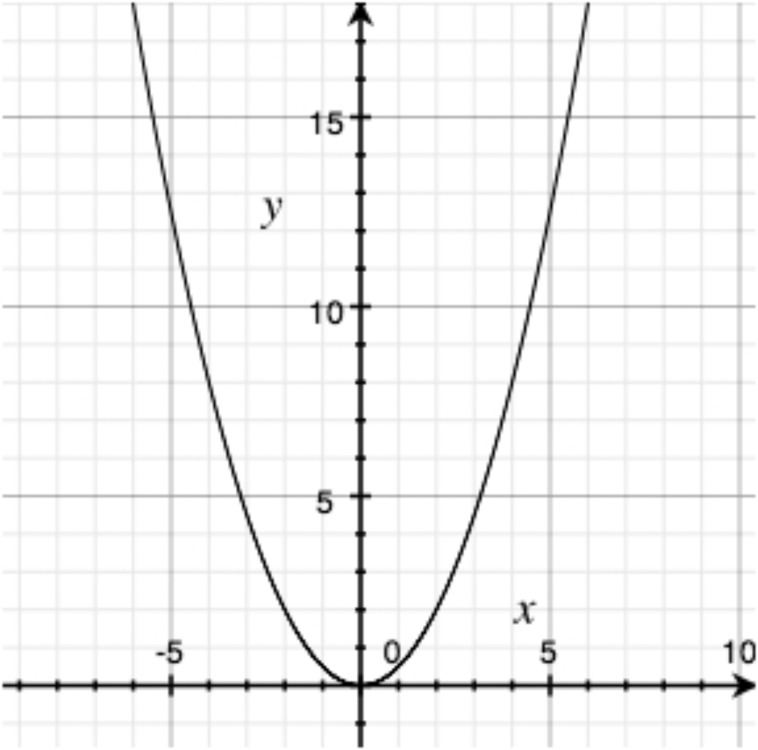
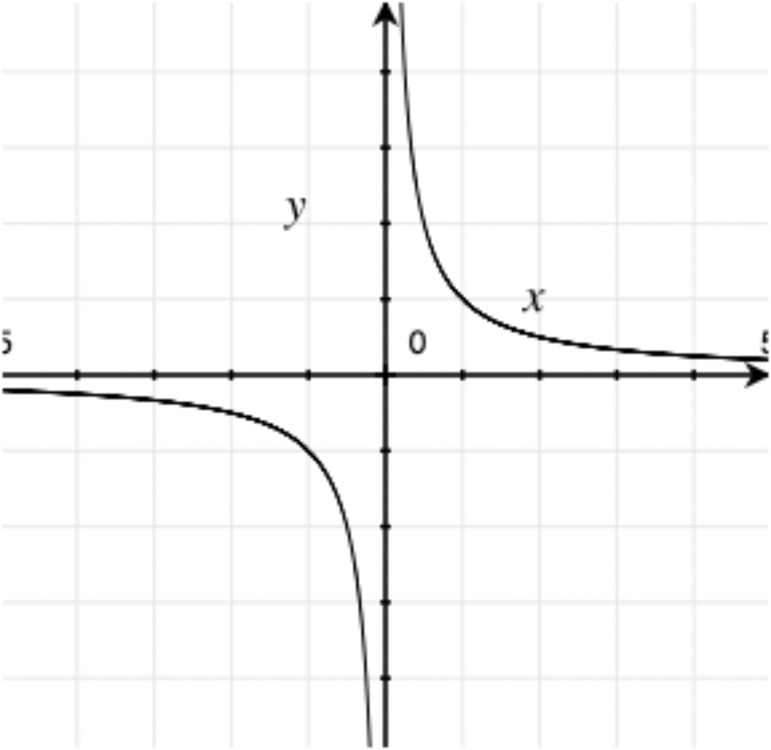
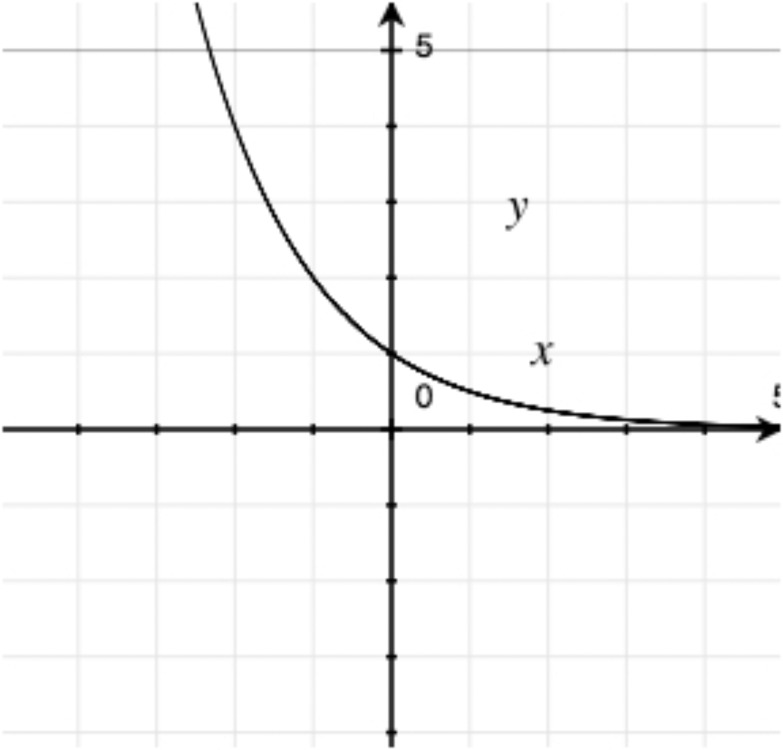
For each graph below, determine what type of function it is. If it’s possible to be even more specific, then do so.
The 1000 employees of the Acme Utensil Factory have been playing an absurdly long game of Blammo. They collected the following data on the number of surviving players on few different days.
|
Days |
Survivors |
|
0 |
1000 |
|
1 |
950 |
|
10 |
599 |
|
20 |
358 |
|
30 |
215 |
|
40 |
129 |
Based on what you know about the shapes of different functions, what types of functions $could$ model these data?
Find an equation that models the data above.
RJ hypothesizes that the death rate in Blammo games is directly proportional to the population. Use your equation to estimate the Blammo death rate on days 1, 3, 10, and 12, and then test RJ’s hypothesis.
Don’t use a calculator for this problem.
Find $x$ if ${\log _2}x = 6$.
Solve for $x$: $(x - 1){(x - 3)^2}(x + 4) = 0$
Subtract: $\dfrac{3}{a} - \dfrac{{7 - b}}{{ab}}$
Simplify: $\dfrac{{\frac{x}{y} + 1}}{{2 - \frac{x}{y}}}$
$\sqrt[{3{\kern 1pt} {\kern 1pt} }]{{162}}$ can be written in the form $a\sqrt[{3{\kern 1pt} {\kern 1pt} }]{b}$ , where $a$ and $b$ are integers and $b$ is as small as possible. What are $a$ and $b$?
Exploring in Depth
In the beginning of this lesson, you saw that the inverse of an exponential function is a logarithmic function. Now, prove that the inverse of a power function is always a power function.
Prove that every equation of the form $y=a{\log _b}x+c$ can be written in the form $y = {\log _B}x + c$ .
Look back at the equation you wrote for $h$ as a function of $t$ in problem 38. Using that equation…
Write an equation that tells you $t$ as a function of the height $h$ of the ball on its way up to its highest point.
Write an equation that tells you $t$ as a function of the height of the ball on the way down.
Why isn’t there only a single answer to the question “What angle has a sine of .4221”?
Your answer to the previous problem implies that the sine function does not have an inverse function. If that is the case, what the heck is your calculator doing when you do ${\sin ^{ - 1}}$ ?
Is it possible to have an inverse function for just part of the sine function? What part?